The Great British Trade-Off 2026
The State of UK Trades Websites 2026
We ran a Lighthouse lab test against 43,738 UK trades business websites, once as a mobile test and once as a desktop test. 31,030 returned a usable result, while failed attempts were kept in the analysis rather than silently discarded. This is what those websites look like when you measure them rather than guess.
By Janusz Wozniak · Published 2026-09-02 · Updated 2026-09-03
Add to preferred sources (opens Google in a new tab)- Websites attempted
- 43,738
- Measured
- 31,030
- Collected
- 2026-07-30 to 2026-09-01
The headline figures
Three measurements and the sample behind them. Each measurement is a median or a share, carries the number of websites behind it, and was recalculated inside both collection waves before it was allowed here. The lead measurement is how long the largest visible content element during loading took to appear in the mobile Lighthouse test, Lighthouse calls it Largest Contentful Paint, and the rest of this report calls it LCP.
The headline measurements, with the number of websites behind each
- Median mobile LCP
- 6.7s
- Sample size 30,399in the mobile Lighthouse test
- Mobile pages with LCP over 4 s in the lab
- 72.5%
- Sample size 30,399
- Median desktop LCP
- 1.4s
- Sample size 30,483the same measurement in the desktop test
- Websites measured
- 31,030
- of 43,738 attempted; the rest returned no usable automated audit on either device
- Sample
- 43,738 websites attempted. Each measurement below shows the number of websites that returned that particular measurement, the attempted count is the population, not the denominator of any figure.
- Source
- Websites for Tradespeople, "The State of UK Trades Websites 2026", dataset 2026-09.2. Lighthouse lab results via the PageSpeed Insights API.
Read this figure with
A seeded city sample, not a representative sample of the UKSeverity: high
Sampling was seeded on a set of major cities: 16 cities contribute several hundred domains each, while the remainder form a long tail. The dataset is large, but it is not a random or weighted sample of UK trades businesses, and no figure here should be read as a national estimate. It describes the 31,030 audited websites in this dataset.
These are laboratory measurementsSeverity: high
Every figure comes from one Lighthouse run of one page, under device emulation, at one moment. Laboratory results describe how a page behaved under controlled conditions. They are not measurements of what visitors experienced, and the thresholds used here are reference points for interpreting a lab run, not an assessment against any third-party programme or a claim about search rankings. The audits ran on Google's servers, which the provider says may be in North America, Europe or Asia and vary per request; which one ran each audit was not recorded.
Nothing was assigned: this is an observational studySeverity: high
Every business in this dataset chose its own platform, its own trade and its own town. The audit measured what already existed, there is no control group, no randomisation and no intervention. A gap between two cohorts is therefore a difference between the sites that sit in them, not a measure of what a platform did to a site. Businesses that pick one platform may differ from those that pick another in ways this dataset did not observe: what they spent, how old the site is, who built it. Every comparison here is reported as a difference between groups, and no figure in this study can say what would happen to a site that moved from one platform to another.
View as a table
| Figure | Value | Websites |
|---|---|---|
| Median mobile LCP (in the mobile Lighthouse test) | 6.7s | 30,399 |
| Mobile pages with LCP over 4 s in the lab | 72.5% | 30,399 |
| Median desktop LCP (the same measurement in the desktop test) | 1.4s | 30,483 |
| Websites measured (of 43,738 attempted; the rest returned no usable automated audit on either device) | 31,030 | , |
Key findings
We requested a Lighthouse audit for 43,738 UK trades business websites, once as a mobile test and once as a desktop test. 31,030 returned a usable result on at least one of the two. Each finding below carries the number of websites that returned that particular measurement; those counts differ from one another, and none of them is 43,738. Every figure here was recalculated inside each collection wave separately, and anything that did not hold across both was left out.
- Half of the 30,399 websites with a mobile LCP took 6.7 seconds or more for their largest contentful element to render. That is a median, not an average: half were slower still. 72.5% of them took over 4 seconds.
- The same websites are slower on mobile than on desktop, almost without exception. Of the 29,969 websites that returned an LCP on both devices, 99.5% recorded a higher one under the mobile strategy, a median of 5.1 seconds apart. Of the 29,965 scored on both, 87.5% scored lower on mobile, a median of 18 points apart. These compare each website against itself rather than one population against another.
- Across all returned scores, median Performance was 67 on mobile (30,397 websites) and 90 on desktop (30,481). Those are different cohorts, which is why the within-site comparison above is the stronger evidence of a device difference.
- Sorted into Lighthouse's own bands, 15.7% of the 30,397 websites with a mobile Performance score sit in “good”, 73.6% in “needs improvement” and 10.7% in “poor”. The middle band holds roughly three websites in four.
- 12,708 of the 43,738 websites attempted returned no usable automated audit on either device, equal to 29.1% of those attempted. That is a failed measurement, not evidence of a broken website. Some attempts failed on our side of the request and others were reported by the audit service as pages it could not load or render; the retained data does not establish the underlying reason for each failure. Those websites remain in the dataset but do not contribute to performance measurements they did not return.
- Platform differences were visible, but they are not causal. We identified a platform for 19,359 websites, or 44.3% of those attempted. Among identified sites, median mobile Performance was 61 for WordPress across 9,869 websites and 69 for Wix across 5,031. That is an observed difference between two groups of websites, not evidence that either platform caused the result.
What these findings do not prove
- Nothing here was assigned. Every business chose its own platform, its own trade and its own town, and the audit measured what was already there.
- So no comparison in this report can carry a cause. Where two groups differ, that is a difference between the websites in them.
- The sample was seeded on a set of cities rather than drawn at random.
- It is not weighted to the UK trades population.
- No figure here is a national estimate.
- Platform figures describe the websites whose platform we identified in this sample. They are not a UK market share.
About the dataset
This is the first edition of an annual study, and dataset 2026-09.2 is the version every figure on this page was produced from. Between 2026-07-30 and 2026-09-01 we requested a Lighthouse audit for 43,738 UK trades business websites, found through listings on a UK business directory, once with Lighthouse's mobile test and once with its desktop test. 31,030 returned a usable result on at least one of the two.
- The dataset narrows at every step, and the steps are not interchangeable. 30,557 websites returned at least one mobile category score and 30,608 at least one desktop score. These device-specific cohorts overlap, but they are not identical. Narrower still are the individual measurements: 30,397 websites returned a mobile Performance score and 30,399 a mobile LCP. 43,738 is the number of websites we attempted, and it is the denominator of none of them.
- 12,708 websites, 29.1% of those attempted, returned no usable automated audit on either device. They stay in the dataset and in the row-level download, and they contribute to no measurement. A failed automated audit is not evidence that a website is broken.
- Collection ran in two near-disjoint passes: 23,525 websites in the first, across 183 towns and cities, and 20,213 in the second, across 18. The two waves differ in date, city set and trade mix at once, so a difference between them cannot be separated from the way the data was gathered. Every figure in this report was therefore recalculated inside each wave before publication, and anything that did not hold across both was left out.
- A platform could be identified for 19,359 websites, 44.3% of those attempted. Detection was a separate request to each homepage rather than part of the audit, so a website that answered neither request appears in neither count.
How to read a Lighthouse lab result
- Each figure comes from one automated audit of one listed page, requested once with PageSpeed Insights' mobile strategy and once with its desktop strategy.
- It is a laboratory measurement. It describes how that page behaved in that test, not what visitors to the website experienced.
- The device and network conditions Google applied were not recorded, and its API does not return them. What is known about how these audits ran, and what is not, is set out in the methodology below.
- Medians, not averages, throughout. The timing distributions have long right tails, and an average would describe the tail rather than the typical website.
- Two of the timing metrics sit at exactly zero for a large share of websites, so they are described by their distribution rather than by a single median.
- An audit that returned nothing is a failed measurement. The retained data does not establish the underlying reason an individual page could not be measured, and a website that could not be measured here may be perfectly serviceable to a visitor.
| Measure | Value |
|---|---|
| Websites attempted | 43,738 |
| Returned a result on at least one device | 31,030 |
| Returned any mobile category score | 30,557 |
| Returned any desktop category score | 30,608 |
| Returned a mobile Performance score | 30,397 |
| Returned a mobile LCP | 30,399 |
| Returned no usable audit on either device | 12,708 |
| A platform could be identified | 44.3% |
| Collected | 2026-07-30 to 2026-09-01 |
C2, Two crawl waves with different audit-failure rates
The audit ran in two near-disjoint waves: 23,525 domains between 30 July and 5 August 2026 across 183 towns and cities, and 20,213 between 30 August and 1 September 2026 across 18 large cities, with only a handful of domains appearing in both. Its mobile audit-failure rate is 30.8% against 29.6%, the share of its domains with no detectable platform is 56.7% against 54.9%, and among those undetected domains the failure rate is 53.0% against 49.9%. The waves therefore differ in date, city set, trade mix and list quality at once, so a gap between them cannot be told apart from the way the data was collected, and it must not be read as a difference between the websites. Platform share is the figure most exposed: it is quoted as a share of the sites that could be identified, with both wave figures beside the pooled one (cms-share.json). Every pooled figure is tested against the wave split before publication; see wave-sensitivity.json.
C3, A seeded city sample, not a representative sample of the UK
Sampling was seeded on a set of major cities: 16 cities contribute several hundred domains each, while the remainder form a long tail. The dataset is large, but it is not a random or weighted sample of UK trades businesses, and no figure here should be read as a national estimate. It describes the 31,030 audited websites in this dataset.
C4, Sites with no detected CMS are partly sites the audit could not load
The mobile audit fails on 51.3% of domains with no detected CMS, against 3.4% where a platform was identified. Platform detection was a separate fetch of the homepage, not part of the audit, but the two are not independent for all that: a site that did not answer the detector could not be fingerprinted, and a site that did not answer one request often did not answer the other. The undetected cohort is therefore selected, not random, and every per-platform row carries both its sample size and its own audit-failure rate so the selection is visible beside the medians rather than in a footnote. Detection also ran at a different time from the audit for the earlier wave: see the platform-detection row of the test conditions.
C7, These are laboratory measurements
Every figure comes from one Lighthouse run of one page, under device emulation, at one moment. Laboratory results describe how a page behaved under controlled conditions. They are not measurements of what visitors experienced, and the thresholds used here are reference points for interpreting a lab run, not an assessment against any third-party programme or a claim about search rankings. The audits ran on Google's servers, which the provider says may be in North America, Europe or Asia and vary per request; which one ran each audit was not recorded.
C10, Total Blocking Time and Layout Shift are concentrated at zero
Total Blocking Time is exactly zero on 35.2% of mobile results and Cumulative Layout Shift on 45.6%. A median of a distribution with that much mass at zero reports the zero and hides the tail. Both are reported as a share-at-zero alongside upper percentiles rather than as a median alone.
C14, A small number of audits returned only some categories
170 mobile and 140 desktop audits returned some category scores but not all, most often the static categories with no performance trace. They are counted in the denominator and contribute only the metrics they actually produced, so any given median may rest on slightly fewer rows than the cohort total. Each figure carries its own sample size.
C19, The dataset holds every website attempted, and almost no figure uses that as its denominator
This dataset is every one of the 43,738 websites the study requested an audit for, including the 12,708 that returned no usable automated audit on either device. That is deliberate: an earlier version of this dataset held only the websites that returned a result, which made the failure rate look far lower than it was and quietly changed the population every share described. Keeping the failed attempts costs nothing in measurement, they carry no scores to average, and it makes the population honest. The consequence is that 43,738 is the number of websites attempted and almost never the right denominator. Every figure in this report is published with the number of websites that returned that particular measurement, and those counts differ from each other: 30,397 websites returned a mobile Performance score, 30,399 a mobile LCP, 30,557 at least one mobile category score. Read the n beside a figure, not the size of the dataset.
How slow is slow in the mobile test
LCP is the measurement this chapter is built on: how long the largest contentful element on the page took to render. Below is the whole spread behind the median in the headline figures, with Google's published LCP reference thresholds marked on it.
- Half of the 30,399 websites with a mobile LCP took 6.7 seconds or more, and 72.5% took over 4 seconds. Both figures were recalculated inside each collection wave before they were published, and both held.
- A single figure is a poor summary of a spread this wide, which is why the chart shows all of it and the table beneath the chart gives the percentiles. The distribution has a long right tail: the axis is capped so the bulk of the data stays legible, and the websites beyond the cap are counted on the chart rather than hidden by it.
- The 2.5-second and 4-second lines are Google's published LCP reference thresholds. Here they are reference points for interpreting a laboratory result and nothing more: not a pass or fail certification, not a claim about search rankings, and not a measurement of what visitors to these websites experienced.
- These are laboratory measurements. The absolute numbers describe the test rather than any particular visitor's connection. The main comparisons in this report were collected through the same PageSpeed Insights request pattern within the same five-week window, and the headline figures used here also held when the two collection waves were recalculated separately. The exact service-side device and network conditions were not retained.
Test your own website
- PageSpeed Insights is public. You can run a mobile PageSpeed Insights test on your own website and read the same LCP metric.
- One run is an estimate. This dataset is a single run per website per device, and a repeat run of the same page can land somewhere else on this chart.
- Your result is not directly comparable with a figure in this report. The conditions the service applied to these audits were not recorded, and there is nothing to confirm it applies the same ones today.
Mobile LCP across every website with a mobile LCP result
Number of sites
LCP, mobile
- 2.5s, Google's published LCP reference threshold for "good", 2.5 s, a reference point for reading a lab result, not a pass mark.
- 4.0s, 72.5% of the 30,399 websites with a mobile LCP result had LCP over 4 s. Google's published LCP reference threshold for "poor", 4 s, a reference point for reading a lab result, not a pass mark.
240 sites above 45.0s, 0.8% of the sample, are drawn as the dashed column past the break, not folded into the last band. The highest single measurement was 476.7s.
View every band as a table
| Band | Sites | Share of sample |
|---|---|---|
| 0ms, 2.3s | 3,344 | 11.00% |
| 2.3s, 4.5s | 6,454 | 21.23% |
| 4.5s, 6.8s | 5,547 | 18.25% |
| 6.8s, 9.0s | 4,979 | 16.38% |
| 9.0s, 11.3s | 3,152 | 10.37% |
| 11.3s, 13.5s | 1,993 | 6.56% |
| 13.5s, 15.8s | 1,412 | 4.64% |
| 15.8s, 18.0s | 919 | 3.02% |
| 18.0s, 20.3s | 677 | 2.23% |
| 20.3s, 22.5s | 480 | 1.58% |
| 22.5s, 24.8s | 340 | 1.12% |
| 24.8s, 27.0s | 253 | 0.83% |
| 27.0s, 29.3s | 157 | 0.52% |
| 29.3s, 31.5s | 106 | 0.35% |
| 31.5s, 33.8s | 103 | 0.34% |
| 33.8s, 36.0s | 73 | 0.24% |
| 36.0s, 38.3s | 58 | 0.19% |
| 38.3s, 40.5s | 42 | 0.14% |
| 40.5s, 42.8s | 39 | 0.13% |
| 42.8s, 45.0s | 31 | 0.10% |
| Above 45.0s | 240 | 0.79% |
One laboratory measurement per site. Bands are equal width and stop at 45.0s; a site above it is counted in the final row rather than folded into the last band. Highest single measurement: 476.7s.
- Sample
- n = 30,399
- Source
- Websites for Tradespeople, "The State of UK Trades Websites 2026", dataset 2026-09.2. Lighthouse lab results via the PageSpeed Insights API.
Read this figure with
These are laboratory measurementsSeverity: high
Every figure comes from one Lighthouse run of one page, under device emulation, at one moment. Laboratory results describe how a page behaved under controlled conditions. They are not measurements of what visitors experienced, and the thresholds used here are reference points for interpreting a lab run, not an assessment against any third-party programme or a claim about search rankings. The audits ran on Google's servers, which the provider says may be in North America, Europe or Asia and vary per request; which one ran each audit was not recorded.
Time to Interactive largely restates Largest Contentful PaintSeverity: medium
Time to Interactive is exactly equal to Largest Contentful Paint on 32.8% of mobile results, and is never lower than it. Lighthouse resolves TTI to the later of its inputs, so on a page with no significant work after the main paint the two collapse together. TTI is published for completeness but carries little information independent of LCP, and it is not used for any headline.
Speed Index partly restates First Contentful PaintSeverity: medium
Speed Index is exactly equal to First Contentful Paint on 26.0% of mobile results. Lighthouse derives Speed Index from how a page's appearance fills in over time, so on a page that reaches its final appearance in a single paint the two collapse together. Published for completeness; not used for any headline.
Total Blocking Time and Layout Shift are concentrated at zeroSeverity: medium
Total Blocking Time is exactly zero on 35.2% of mobile results and Cumulative Layout Shift on 45.6%. A median of a distribution with that much mass at zero reports the zero and hides the tail. Both are reported as a share-at-zero alongside upper percentiles rather than as a median alone.
The dataset holds every website attempted, and almost no figure uses that as its denominatorSeverity: high
This dataset is every one of the 43,738 websites the study requested an audit for, including the 12,708 that returned no usable automated audit on either device. That is deliberate: an earlier version of this dataset held only the websites that returned a result, which made the failure rate look far lower than it was and quietly changed the population every share described. Keeping the failed attempts costs nothing in measurement, they carry no scores to average, and it makes the population honest. The consequence is that 43,738 is the number of websites attempted and almost never the right denominator. Every figure in this report is published with the number of websites that returned that particular measurement, and those counts differ from each other: 30,397 websites returned a mobile Performance score, 30,399 a mobile LCP, 30,557 at least one mobile category score. Read the n beside a figure, not the size of the dataset.
View as a table
| Percentile | Value |
|---|---|
| p10 | 2.0s |
| p25 | 3.8s |
| median | 6.7s |
| p75 | 10.7s |
| p90 | 16.7s |
| p95 | 22.0s |
| p99 | 40.8s |
| max | 476.7s |
The four Lighthouse categories, in Lighthouse's bands
Lighthouse returns four category scores, not one, and each is scored out of 100 and sorted into the same three bands. Performance is the category this report leads on. The other three are checklists of things Lighthouse can test on the page, and they sit in quite different places.
What is a good PageSpeed score, and what did these websites actually score?
- Lighthouse sets the bands, and they are the same for every category: 90 to 100 is “good”, 50 to 89 is “needs improvement” and below 50 is “poor”. That is a definition, not a finding, it is where the lines are drawn, whatever any website scores.
- What this study adds is where real websites fell between those lines. Across the 30,397 websites that returned a mobile Performance score, the median was 67: 15.7% reached the good band, 73.6% sat in needs improvement and 10.7% in poor.
- So a score in the sixties is not unusual among the trades websites in this sample, it is close to the middle of them. That is a description of this sample under one laboratory test, not a target, a pass mark or a statement about any individual website.
- On mobile the median Performance score is 67 across 30,397 websites, against 89 for Accessibility (30,557 websites), 81 for Best Practices (30,538) and 92 for SEO (30,545). Each category has its own cohort, because a website can return one category's score without returning another's.
- Performance is also the category with the widest spread. 10.7% of the 30,397 websites with a mobile Performance score sit in Lighthouse's lowest band, 73.6% in the middle band and 15.7% in the highest. The other three categories are drawn on the same bands in the table below; their splits were not tested across the collection waves, so they are shown there and not quoted here.
- The SEO category is the one most often misread. It is a set of automated checks for a subset of technical and on-page SEO basics that Lighthouse can test, scored out of 100. It is not a ranking score, it does not measure search visibility, and a high score here does not tell us how a search engine ranks the page.
- Across the 30,481 websites that returned a desktop Performance score, the median is 90. That is a different cohort from the mobile one, which is why the device comparison in the next section is made on the websites that returned a score on both devices rather than by setting these two medians against each other.
What each category measures
- Performance, a weighted score built from several laboratory performance metrics, including LCP.
- Accessibility, automated checks for things like colour contrast, image alternatives and form labels. Automated testing covers part of accessibility, not all of it, so a high score is not an accessibility audit.
- Best Practices, a mixed checklist covering matters such as HTTPS, console errors and deprecated browser features.
- SEO, automated checks for a subset of technical and on-page SEO basics that Lighthouse can test. It is not a ranking score, it does not measure search visibility, and a high score does not tell us how a search engine ranks the page.
Every website with a score, sorted into Lighthouse's three score bands
- Poor
- Needs improvement
- Good
Performance, mobile
n = 30,397
Bands too narrow to label: Poor 10.7%
Performance, desktop
n = 30,481
Bands too narrow to label: Poor 2.8%
Accessibility, mobile
n = 30,557
Bands too narrow to label: Poor 0.8%
Accessibility, desktop
n = 30,608
Bands too narrow to label: Poor 0.7%
SEO, mobile
n = 30,545
Bands too narrow to label: Poor 5.4%
SEO, desktop
n = 30,599
Bands too narrow to label: Poor 5.4%
Best Practices, mobile
n = 30,538
Bands too narrow to label: Poor 1.0%
Best Practices, desktop
n = 30,589
Bands too narrow to label: Poor 0.9%
View as a table
| Group | n | Poor (sites) | Needs improvement (sites) | Good (sites) | Poor (share) | Needs improvement (share) | Good (share) |
|---|---|---|---|---|---|---|---|
| Performance, mobile | 30,397 | 3,264 | 22,365 | 4,768 | 10.7% | 73.6% | 15.7% |
| Performance, desktop | 30,481 | 864 | 13,907 | 15,710 | 2.8% | 45.6% | 51.5% |
| Accessibility, mobile | 30,557 | 244 | 15,343 | 14,970 | 0.8% | 50.2% | 49.0% |
| Accessibility, desktop | 30,608 | 221 | 14,928 | 15,459 | 0.7% | 48.8% | 50.5% |
| SEO, mobile | 30,545 | 1,645 | 7,941 | 20,959 | 5.4% | 26.0% | 68.6% |
| SEO, desktop | 30,599 | 1,656 | 7,801 | 21,142 | 5.4% | 25.5% | 69.1% |
| Best Practices, mobile | 30,538 | 300 | 18,621 | 11,617 | 1.0% | 61.0% | 38.0% |
| Best Practices, desktop | 30,589 | 284 | 18,428 | 11,877 | 0.9% | 60.2% | 38.8% |
- Sample
- n = 30,557
- Source
- Websites for Tradespeople, "The State of UK Trades Websites 2026", dataset 2026-09.2. Lighthouse lab results via the PageSpeed Insights API.
Read this figure with
A seeded city sample, not a representative sample of the UKSeverity: high
Sampling was seeded on a set of major cities: 16 cities contribute several hundred domains each, while the remainder form a long tail. The dataset is large, but it is not a random or weighted sample of UK trades businesses, and no figure here should be read as a national estimate. It describes the 31,030 audited websites in this dataset.
These are laboratory measurementsSeverity: high
Every figure comes from one Lighthouse run of one page, under device emulation, at one moment. Laboratory results describe how a page behaved under controlled conditions. They are not measurements of what visitors experienced, and the thresholds used here are reference points for interpreting a lab run, not an assessment against any third-party programme or a claim about search rankings. The audits ran on Google's servers, which the provider says may be in North America, Europe or Asia and vary per request; which one ran each audit was not recorded.
A small number of audits returned only some categoriesSeverity: low
170 mobile and 140 desktop audits returned some category scores but not all, most often the static categories with no performance trace. They are counted in the denominator and contribute only the metrics they actually produced, so any given median may rest on slightly fewer rows than the cohort total. Each figure carries its own sample size.
The dataset holds every website attempted, and almost no figure uses that as its denominatorSeverity: high
This dataset is every one of the 43,738 websites the study requested an audit for, including the 12,708 that returned no usable automated audit on either device. That is deliberate: an earlier version of this dataset held only the websites that returned a result, which made the failure rate look far lower than it was and quietly changed the population every share described. Keeping the failed attempts costs nothing in measurement, they carry no scores to average, and it makes the population honest. The consequence is that 43,738 is the number of websites attempted and almost never the right denominator. Every figure in this report is published with the number of websites that returned that particular measurement, and those counts differ from each other: 30,397 websites returned a mobile Performance score, 30,399 a mobile LCP, 30,557 at least one mobile category score. Read the n beside a figure, not the size of the dataset.
View as a table
| Category | Poor (0 to 49) | Needs improvement (50 to 89) | Good (90 to 100) | Websites |
|---|---|---|---|---|
| Performance, mobile | 10.7% | 73.6% | 15.7% | 30,397 |
| Performance, desktop | 2.8% | 45.6% | 51.5% | 30,481 |
| Accessibility, mobile | 0.8% | 50.2% | 49.0% | 30,557 |
| Accessibility, desktop | 0.7% | 48.8% | 50.5% | 30,608 |
| SEO, mobile | 5.4% | 26.0% | 68.6% | 30,545 |
| SEO, desktop | 5.4% | 25.5% | 69.1% | 30,599 |
| Best Practices, mobile | 1.0% | 61.0% | 38.0% | 30,538 |
| Best Practices, desktop | 0.9% | 60.2% | 38.8% | 30,589 |
Mobile against desktop
The same websites, measured twice. This section compares a website's two results against each other, the same listed URL requested once with PageSpeed Insights' mobile strategy and once with its desktop strategy, rather than setting one population's median against another's. The mobile and desktop cohorts are not the same websites, so subtracting one median from the other would describe no website at all.
- Of the 29,965 websites that returned a Performance score on both devices, 87.5% scored lower under the mobile strategy, and the median within-site gap is 18 points.
- Among the 29,969 websites that returned an LCP on both devices, 99.5% recorded a higher LCP under the mobile strategy. The median within-site difference was 5.1 seconds. This is a comparison of one website's two laboratory results, not a measurement of what anyone waited for, and the dataset does not say why the two differ.
- Those are the four measurements this section quotes, and each was recalculated inside both collection waves before publication. The counts below are sample sizes, not measurements. Everything else is in the table, described rather than quoted.
- Every metric has its own paired cohort, because a website can return a measurement on one device and not on the other. Performance is paired on 29,965 websites, LCP on 29,969, First Contentful Paint on 30,043, Speed Index on 30,038, and the other category scores on up to 30,135. Read the pair count beside a row, not the size of the dataset.
- Directions differ between the measurements, so the chart states each one beside the row it belongs to: for Largest Contentful Paint a lower value is the better result, and for the Performance score a higher value is the better result.
- Two of the paired measurements are not summarised by a median here. Total Blocking Time and Cumulative Layout Shift sit at exactly zero for a large share of websites on both devices, so a median of the within-site gap would report that zero and hide everything either side of it. They are paired in the dataset and in the download, and they are neither drawn nor tabulated here. Two more, Time to Interactive and Speed Index, repeat LCP and First Contentful Paint on a large share of these websites, so they are paired in the dataset but not drawn beside them either.
- This compares two laboratory tests of the same listed URL, not two audiences. Nothing here says that visitors using a phone experienced the mobile result or that visitors using a desktop experienced the desktop result. Nor does the dataset say why any website's two results differ: page weight, hosting, scripts and layout were not measured, and the conditions the service applied to each test were not retained.
The same websites, measured under the mobile and desktop Lighthouse strategies
2 measurements, each taken twice on the same website. Mobile comes out worse on 2 of them.
Every row is scaled to its own longest bar. The rows mix scores with timings, so bar lengths mean something within a row and nothing between rows. Each row prints the scale it was drawn to.
- Solid bar: Mobile
- Outlined bar: Desktop
Solid against outlined, and every bar carries its name in writing, so nothing here depends on telling two colours apart.
Largest Contentful Paint
Lower is better · n = 29,969
Scale for this row only: 0ms to 6.7s
Same-site gap: Mobile worse by 5.1s
Performance
Higher is better · n = 29,965
Scale for this row only: 0 to 90
Same-site gap: Mobile worse by 18
n is the number of websites with a usable figure for both Mobile and Desktop. It varies by row because an audit can fail for one measurement and not the other.
The same-site gap is worked out on each website first, then summarised across websites, so it will not always match the difference between the two bars.
Mobile and Desktop are two measurement configurations of the same listed address in the lab. They are a reference point, not two groups of visitors.
- Sample
- Paired results only: each row compares one website's two results. Every metric has its own pair count, from 29,965 to 30,135 websites; the Performance pair is 29,965.
- Source
- Websites for Tradespeople, "The State of UK Trades Websites 2026", dataset 2026-09.2. Lighthouse lab results via the PageSpeed Insights API.
Read this figure with
These are laboratory measurementsSeverity: high
Every figure comes from one Lighthouse run of one page, under device emulation, at one moment. Laboratory results describe how a page behaved under controlled conditions. They are not measurements of what visitors experienced, and the thresholds used here are reference points for interpreting a lab run, not an assessment against any third-party programme or a claim about search rankings. The audits ran on Google's servers, which the provider says may be in North America, Europe or Asia and vary per request; which one ran each audit was not recorded.
Time to Interactive largely restates Largest Contentful PaintSeverity: medium
Time to Interactive is exactly equal to Largest Contentful Paint on 32.8% of mobile results, and is never lower than it. Lighthouse resolves TTI to the later of its inputs, so on a page with no significant work after the main paint the two collapse together. TTI is published for completeness but carries little information independent of LCP, and it is not used for any headline.
Speed Index partly restates First Contentful PaintSeverity: medium
Speed Index is exactly equal to First Contentful Paint on 26.0% of mobile results. Lighthouse derives Speed Index from how a page's appearance fills in over time, so on a page that reaches its final appearance in a single paint the two collapse together. Published for completeness; not used for any headline.
Total Blocking Time and Layout Shift are concentrated at zeroSeverity: medium
Total Blocking Time is exactly zero on 35.2% of mobile results and Cumulative Layout Shift on 45.6%. A median of a distribution with that much mass at zero reports the zero and hides the tail. Both are reported as a share-at-zero alongside upper percentiles rather than as a median alone.
The SEO category barely varies between devicesSeverity: low
Mobile and desktop SEO scores are identical on 95.1% of domains audited on both. The category is built largely from device-independent checks, so it is reported as a single figure rather than framed as a mobile-versus-desktop comparison.
A small number of audits returned only some categoriesSeverity: low
170 mobile and 140 desktop audits returned some category scores but not all, most often the static categories with no performance trace. They are counted in the denominator and contribute only the metrics they actually produced, so any given median may rest on slightly fewer rows than the cohort total. Each figure carries its own sample size.
The dataset holds every website attempted, and almost no figure uses that as its denominatorSeverity: high
This dataset is every one of the 43,738 websites the study requested an audit for, including the 12,708 that returned no usable automated audit on either device. That is deliberate: an earlier version of this dataset held only the websites that returned a result, which made the failure rate look far lower than it was and quietly changed the population every share described. Keeping the failed attempts costs nothing in measurement, they carry no scores to average, and it makes the population honest. The consequence is that 43,738 is the number of websites attempted and almost never the right denominator. Every figure in this report is published with the number of websites that returned that particular measurement, and those counts differ from each other: 30,397 websites returned a mobile Performance score, 30,399 a mobile LCP, 30,557 at least one mobile category score. Read the n beside a figure, not the size of the dataset.
View as a table
| Measurement | Mobile | Desktop | Worse on mobile | Websites |
|---|---|---|---|---|
| Largest Contentful Paint | 6.7s | 1.4s | 99.5% | 29,969 |
| Performance | 67 | 90 | 87.5% | 29,965 |
8 further Lighthouse measurements are paired the same way in the dataset. They are not drawn here: the report leads on LCP and the Performance score, and two of the others repeat LCP or First Contentful Paint for a large share of sites (C8, C9).
How the platforms compare
Median mobile Performance by platform, for the websites whose platform we identified. The chart carries the comparison with enough websites on both sides to hold across the two collection waves and after restricting the analysis to stronger platform fingerprints: Wix against WordPress, pooled and then restricted, with both waves' figures marked on each bar. Every other platform is in the table, with the number of websites behind its median and how often its audits failed.
- Among the websites we identified, the median mobile Performance score is 61 for WordPress (9,869 websites with a mobile Performance score) and 69 for Wix (5,031), 8 points apart across the 14,900 websites in the two groups combined.
- Detector strength is not neutral, so the same comparison is made again on firmer ground. Restricted to the websites whose platform was identified from a strong fingerprint, the medians are 60 for WordPress (8,374 websites) and 67 for Wix (3,841), 7 points apart across 12,215. The difference narrows but does not disappear, and all four medians and both gaps held when the collection waves were recalculated separately.
- Squarespace's median, 54 across 600 websites, also held across the waves. The other platforms' medians are in the table and are not quoted here, because they were not tested across the waves, including the platform with the highest median in the table, which was tested and did not hold. Leaving the top of a table unquoted without saying so would be a choice disguised as a result, so it is said here.
- Each row carries its own audit-failure rate, and those rates differ materially across the table. A platform whose websites returned a measurement less often is represented in its median by the ones that answered, so read a median beside the failure rate in the same row. The undetected-platform row needs particular caution, because missing platform detection and missing Lighthouse results are related in this dataset.
- These are differences between groups of websites, and the study cannot say more than that. Nothing was assigned: every business chose its own platform, and businesses that choose one platform can differ from those that choose another in ways this dataset did not observe, budget, who built the site, how old it is, and how complex its content or functionality is. There is no control group and no intervention here. The next section narrows the question by holding the trade constant.
Wix against WordPress, median mobile Performance score, with both waves marked
Median mobile Performance score: Wix against WordPress, in 2 rows. Every bar is drawn on one scale, from 0 to 100, so a bar in one row can be compared with a bar in any other. A longer bar is a better result. The markers on a bar are the same figure recalculated inside each collection wave; the pooled figure is printed beside the bar and both wave figures beneath it.
- Solid bar: Wix
- Outlined bar: WordPress
- Marker: the same figure inside one collection wave
Solid against outlined, and every bar carries its name and its figure in writing, so nothing here depends on telling two colours apart.
All identified sites
Wix69n = 5,031 · Wave 1 70 (n = 2,836) · Wave 2 69 (n = 2,195)
WordPress61n = 9,869 · Wave 1 61 (n = 5,282) · Wave 2 61 (n = 4,587)
WordPress minus Wix: −8 points pooled; −9 in wave 1, −8 in wave 2, robust across the split.
Strong fingerprint only
Wix67n = 3,841 · Wave 1 67 (n = 2,076) · Wave 2 67 (n = 1,765)
WordPress60n = 8,374 · Wave 1 60 (n = 4,506) · Wave 2 60 (n = 3,868)
WordPress minus Wix: −7 points pooled; −7 in wave 1, −7 in wave 2, robust across the split.
- Sample
- 30,557 websites with a mobile result. The n beneath each bar counts the websites with a mobile Performance score; the table's Websites column counts every site with a mobile result, which is slightly larger.
- Source
- Websites for Tradespeople, "The State of UK Trades Websites 2026", dataset 2026-09.2. Lighthouse lab results via the PageSpeed Insights API.
Read this figure with
Two crawl waves with different audit-failure ratesSeverity: high
The audit ran in two near-disjoint waves: 23,525 domains between 30 July and 5 August 2026 across 183 towns and cities, and 20,213 between 30 August and 1 September 2026 across 18 large cities, with only a handful of domains appearing in both. Its mobile audit-failure rate is 30.8% against 29.6%, the share of its domains with no detectable platform is 56.7% against 54.9%, and among those undetected domains the failure rate is 53.0% against 49.9%. The waves therefore differ in date, city set, trade mix and list quality at once, so a gap between them cannot be told apart from the way the data was collected, and it must not be read as a difference between the websites. Platform share is the figure most exposed: it is quoted as a share of the sites that could be identified, with both wave figures beside the pooled one (cms-share.json). Every pooled figure is tested against the wave split before publication; see wave-sensitivity.json.
Sites with no detected CMS are partly sites the audit could not loadSeverity: high
The mobile audit fails on 51.3% of domains with no detected CMS, against 3.4% where a platform was identified. Platform detection was a separate fetch of the homepage, not part of the audit, but the two are not independent for all that: a site that did not answer the detector could not be fingerprinted, and a site that did not answer one request often did not answer the other. The undetected cohort is therefore selected, not random, and every per-platform row carries both its sample size and its own audit-failure rate so the selection is visible beside the medians rather than in a footnote. Detection also ran at a different time from the audit for the earlier wave: see the platform-detection row of the test conditions.
Platform comparisons are repeated within strong fingerprintsSeverity: medium
In this dataset the CMS Confidence value "low" is exactly equivalent to an undetected CMS, the two counts match to the row, so on the undetected sites confidence is not a third level. It is collapsed into a detector strength that is null whenever no CMS was found, and that identity is re-proved on every pipeline run. On identified sites, the detector's confidence level is retained rather than discarded. Every platform comparison in this report is therefore made twice: once across all identified websites and once within strong fingerprints only, so the result can be checked without relying on the weaker identifications. Only platform differences that satisfy the report's wave-sensitivity rules are quoted as findings. Differences between fingerprint-confidence strata are not treated as findings in this report.
These are laboratory measurementsSeverity: high
Every figure comes from one Lighthouse run of one page, under device emulation, at one moment. Laboratory results describe how a page behaved under controlled conditions. They are not measurements of what visitors experienced, and the thresholds used here are reference points for interpreting a lab run, not an assessment against any third-party programme or a claim about search rankings. The audits ran on Google's servers, which the provider says may be in North America, Europe or Asia and vary per request; which one ran each audit was not recorded.
Nothing was assigned: this is an observational studySeverity: high
Every business in this dataset chose its own platform, its own trade and its own town. The audit measured what already existed, there is no control group, no randomisation and no intervention. A gap between two cohorts is therefore a difference between the sites that sit in them, not a measure of what a platform did to a site. Businesses that pick one platform may differ from those that pick another in ways this dataset did not observe: what they spent, how old the site is, who built it. Every comparison here is reported as a difference between groups, and no figure in this study can say what would happen to a site that moved from one platform to another.
The dataset holds every website attempted, and almost no figure uses that as its denominatorSeverity: high
This dataset is every one of the 43,738 websites the study requested an audit for, including the 12,708 that returned no usable automated audit on either device. That is deliberate: an earlier version of this dataset held only the websites that returned a result, which made the failure rate look far lower than it was and quietly changed the population every share described. Keeping the failed attempts costs nothing in measurement, they carry no scores to average, and it makes the population honest. The consequence is that 43,738 is the number of websites attempted and almost never the right denominator. Every figure in this report is published with the number of websites that returned that particular measurement, and those counts differ from each other: 30,397 websites returned a mobile Performance score, 30,399 a mobile LCP, 30,557 at least one mobile category score. Read the n beside a figure, not the size of the dataset.
View as a table
| Platform | Mobile Performance | Desktop Performance | Mobile LCP | Accessibility | Audit failed | Websites |
|---|---|---|---|---|---|---|
| No CMS detected | 70 | 94 | 5.4s | 85 | 51.3% | 11,861 |
| WordPress | 61 | 85 | 8.1s | 88 | 3.5% | 9,887 |
| Wix | 69 | 91 | 6.9s | 94 | 2.4% | 5,033 |
| Duda | 77 | 94 | 4.8s | 89 | 1.9% | 1,804 |
| Squarespace | 54 | 79 | 12.7s | 95 | 2.7% | 607 |
| GoDaddy Website Builder | 77 | 93 | 4.2s | 87 | 14.5% | 562 |
| Weebly | 61 | 89 | 7.5s | 82 | 1.6% | 253 |
| Webflow | 57 | 81 | 9.7s | 89 | 3.1% | 216 |
| Joomla | 61 | 82 | 7.9s | 85 | 4.2% | 138 |
| Shopify | 59 | 79 | 8.4s | 89 | 7.5% | 135 |
| Drupal | — | — | — | — | 1.6% | 61 |
"No CMS detected" is listed but not compared. It is not a platform, and 51.3% of those sites returned no mobile result, so the sites most likely to score badly are disproportionately the ones missing from its median (C4). Duda's median mobile Performance did not hold across the two collection waves (78 in wave 1, 75 in wave 2), so it is listed here and not treated as a headline (C2). Platforms are not ranked. A row with an em dash had too few websites for a median; its sample size is still shown.
The same trade, different platforms
Comparing platforms across the whole dataset invites an obvious objection: different kinds of business choose different platforms. These comparisons hold the trade constant, which removes one of those differences and not the rest. The chart shows Wix and WordPress in every trade with enough websites on both sides; the table shows every cell.
- A cell is one platform inside one trade. A cell needs 100 websites before it carries a median, so a trade appears in the chart only where both platforms clear that bar, and the table marks the cells that do not. Every median in the table is published with the number of websites behind it, and those counts differ from cell to cell.
- Across the 12 trades with enough WordPress and Wix websites for a comparison, the WordPress group has the lower median mobile Performance score in every one: no ties and no reversals. Repeating the test inside each collection wave, and rebuilding the eligible set from scratch each time rather than carrying the pooled one in, the direction holds again, 4 qualifying trades in the first wave and 8 in the second, with WordPress lower in all of them, again with no ties and no reversals.
- Read that narrowly. The wave sets are smaller than the pooled set and are largely different trades, so this is not the same 12 trades measured twice over. It is not a controlled experiment, it does not show that either platform caused a score, and it says nothing about what would happen to a website that moved from one to the other. What it supports is one narrow point: the difference between the two platforms in the previous section does not appear to be explained by trade mix alone.
- The individual cell figures, each trade's two medians and the gap between them, were not themselves recalculated inside the waves, so this section quotes none of them. They are in the chart and the table.
- Holding the trade constant removes one difference between the two groups of websites and leaves the others in place. The businesses inside a single trade still differ in budget, in who built the site, in how old it is and in how complex its content or functionality is, and none of that was observed here. A trade's cells are also drawn from different mixtures of towns and collection waves.
- So this is a narrower question than the one before it, not an answer to it. Nothing was assigned, there is no control group, and a difference inside a trade remains a difference between the websites in that trade that chose each platform.
Median mobile Performance by platform, within each trade
Median mobile Performance score, within the trade: Wix against WordPress, in 12 rows. Every bar is drawn on one scale, from 0 to 100, so a bar in one row can be compared with a bar in any other. A longer bar is a better result.
- Solid bar: Wix
- Outlined bar: WordPress
Solid against outlined, and every bar carries its name and its figure in writing, so nothing here depends on telling two colours apart.
Plumbers
Wix71n = 656
WordPress62n = 1,538
Driveways
Wix69n = 353
WordPress60n = 471
Roofers
Wix70n = 317
WordPress60n = 434
Electricians
Wix68n = 198
WordPress63n = 403
Window Cleaners
Wix71n = 182
WordPress61n = 408
Builders
Wix69n = 232
WordPress60n = 351
Flooring Services
Wix68n = 125
WordPress61n = 342
Painters And Decorators
Wix70n = 152
WordPress64.5n = 244
Joiners
Wix69n = 169
WordPress63n = 235
Domestic Cleaners
Wix69n = 137
WordPress62n = 191
Gardeners
Wix69n = 129
WordPress60n = 185
Plasterers
Wix69n = 114
WordPress64n = 156
- Sample
- only cells with at least 100 websites holding a mobile Performance score carry a figure. Holding the trade constant removes one difference between these groups, not all of them.
- Source
- Websites for Tradespeople, "The State of UK Trades Websites 2026", dataset 2026-09.2. Lighthouse lab results via the PageSpeed Insights API.
Read this figure with
Sites with no detected CMS are partly sites the audit could not loadSeverity: high
The mobile audit fails on 51.3% of domains with no detected CMS, against 3.4% where a platform was identified. Platform detection was a separate fetch of the homepage, not part of the audit, but the two are not independent for all that: a site that did not answer the detector could not be fingerprinted, and a site that did not answer one request often did not answer the other. The undetected cohort is therefore selected, not random, and every per-platform row carries both its sample size and its own audit-failure rate so the selection is visible beside the medians rather than in a footnote. Detection also ran at a different time from the audit for the earlier wave: see the platform-detection row of the test conditions.
Platform comparisons are repeated within strong fingerprintsSeverity: medium
In this dataset the CMS Confidence value "low" is exactly equivalent to an undetected CMS, the two counts match to the row, so on the undetected sites confidence is not a third level. It is collapsed into a detector strength that is null whenever no CMS was found, and that identity is re-proved on every pipeline run. On identified sites, the detector's confidence level is retained rather than discarded. Every platform comparison in this report is therefore made twice: once across all identified websites and once within strong fingerprints only, so the result can be checked without relying on the weaker identifications. Only platform differences that satisfy the report's wave-sensitivity rules are quoted as findings. Differences between fingerprint-confidence strata are not treated as findings in this report.
Trade labels are the source's, unmerged, and 17.7% are absentSeverity: medium
7,740 domains carry no trade label in the source; they are reported as their own cohort rather than dropped or reassigned. Related labels that a reader might expect to be combined, carpenters and joiners, gardeners and landscape gardeners, are kept separate, because merging them is an editorial judgement about trades rather than a correction to the data.
Nothing was assigned: this is an observational studySeverity: high
Every business in this dataset chose its own platform, its own trade and its own town. The audit measured what already existed, there is no control group, no randomisation and no intervention. A gap between two cohorts is therefore a difference between the sites that sit in them, not a measure of what a platform did to a site. Businesses that pick one platform may differ from those that pick another in ways this dataset did not observe: what they spent, how old the site is, who built it. Every comparison here is reported as a difference between groups, and no figure in this study can say what would happen to a site that moved from one platform to another.
Trade is confounded with wave, city set and platform mixSeverity: high
Across the 26 trades large enough to rank, the share of a trade's sites collected in the first wave runs from 14.0% to 98.6%, 2 trades are drawn at least 90% from a single wave, and the waves differ in city coverage, audit-failure rate and seed-list quality (C2). The share of sites on WordPress runs from 21.7% to 46.5% and the share with no detectable platform from 32.3% to 48.5%, and platforms differ in median mobile Performance (cms-performance.json). A difference between two trades is therefore a difference between two mixtures of towns, waves and platforms that this study has not separated. The spread of trade medians (63 to 72) is also small beside the spread within a trade: the pooled interquartile range of the same score is 58 to 81. Trade exhibits are ordered by sample size rather than by score, the table is not a league table, and this study does not measure why any trade's sites score as they do.
View as a table
| Trade | No CMS detected | WordPress | Wix | Duda |
|---|---|---|---|---|
| Plumbers | 71 (n=2,064) | 62 (n=1,538) | 71 (n=656) | 80 (n=272) |
| Driveways | 68 (n=514) | 60 (n=471) | 69 (n=353) | 79 (n=113) |
| Roofers | 70 (n=516) | 60 (n=434) | 70 (n=317) | — (n=68) |
| Electricians | 74 (n=574) | 63 (n=403) | 68 (n=198) | — (n=60) |
| Window Cleaners | 72 (n=510) | 61 (n=408) | 71 (n=182) | — (n=61) |
| Builders | 71 (n=448) | 60 (n=351) | 69 (n=232) | — (n=59) |
| Flooring Services | 69.5 (n=367) | 61 (n=342) | 68 (n=125) | — (n=41) |
| Painters And Decorators | 71.5 (n=350) | 64.5 (n=244) | 70 (n=152) | — (n=84) |
| Joiners | 70 (n=330) | 63 (n=235) | 69 (n=169) | — (n=48) |
| Kitchen Fitters | 67.5 (n=301) | 59 (n=289) | — (n=93) | — (n=31) |
| Domestic Cleaners | 71 (n=328) | 62 (n=191) | 69 (n=137) | — (n=38) |
| Gas Engineers | 69 (n=302) | 61 (n=243) | — (n=97) | — (n=45) |
| Gardeners | 73 (n=252) | 60 (n=185) | 69 (n=129) | — (n=24) |
| Double Glazing | 68 (n=202) | 58 (n=282) | — (n=60) | — (n=36) |
| Tree Surgeons | 67 (n=193) | 62 (n=241) | — (n=69) | — (n=40) |
| Locksmiths | 76 (n=279) | 62 (n=201) | — (n=63) | — (n=21) |
| Glaziers | 70 (n=190) | 59 (n=229) | — (n=97) | — (n=44) |
| Carpet Cleaners | 77 (n=249) | 63 (n=185) | — (n=59) | — (n=19) |
| Scaffolders | 67 (n=172) | 60 (n=199) | — (n=99) | — (n=34) |
| Plasterers | 70 (n=178) | 64 (n=156) | 69 (n=114) | — (n=27) |
| Bathroom Fitters | 66 (n=182) | 63 (n=168) | — (n=67) | — (n=13) |
| Garage Doors | 70 (n=157) | 59 (n=159) | — (n=56) | — (n=29) |
| Pest Control | 68 (n=154) | 62 (n=149) | — (n=48) | — (n=16) |
| Washing Machine Repairs | 71 (n=181) | — (n=81) | — (n=46) | — (n=44) |
| Handyman Services | 75 (n=147) | 70 (n=109) | — (n=64) | — (n=19) |
| Fencing Contractors | 66 (n=115) | 61.5 (n=108) | — (n=52) | — (n=35) |
| Tilers | 70 (n=131) | — (n=66) | — (n=45) | — (n=19) |
| Damp Proofing | 68.5 (n=101) | — (n=95) | — (n=48) | — (n=14) |
| Guttering Services | — (n=82) | — (n=90) | — (n=48) | — (n=21) |
| Boiler Repairs | — (n=97) | — (n=67) | — (n=16) | — (n=13) |
| Landscape Gardeners | — (n=75) | — (n=69) | — (n=23) | — (n=12) |
| Chimney Sweeps | — (n=67) | — (n=65) | — (n=40) | — (n=10) |
| Bricklayers | — (n=75) | — (n=55) | — (n=22) | — (n=12) |
| Loft Conversions | — (n=73) | — (n=61) | — (n=26) | — (n=6) |
A cell shows an em dash where that combination had too few websites with a mobile Performance score to publish a median. Its sample size is still shown, and where a cell has enough websites but too few scores, the number of scores is shown beside the dash. Nothing here is ranked and no difference is computed for the reader: the sites in each cell chose their platform, and the trade is the only thing held constant. Across this cohort the audit returned no mobile result for 50.5% of sites with no CMS detected, 3.4% of WordPress sites, 2.3% of Wix sites, 1.5% of Duda sites, so the medians in the "No CMS detected" column describe the sites that loaded, and the ones most likely to score badly are the ones most likely to be missing from them (C4).
How the page builders compare
The same builders, with the lower and upper quartile beside each median so the spread behind it is visible. The residual cohort is listed last and outside any comparison, for the reason given above.
- A median is one point in a distribution. The interquartile ranges overlap substantially: the quartile columns show how far each builder’s middle half reaches, and those ranges sit across one another rather than in a line. A website in one group can therefore sit above the median of another, which is why the medians should not be read as clean dividing lines between builders. The quartiles are descriptive figures for this dataset pooled, were not recalculated inside the collection waves, and are not quoted outside this table.
- Each row also carries its own audit-failure rate and the number of websites behind each figure, and the counts are not the same from column to column: a website can return a Performance score without returning an LCP. Read the count in the row rather than the size of the cohort above it.
- Nothing in this table is ranked, and no row is a recommendation. These are groups of WordPress websites that differ in ways this dataset did not observe, drawn from different mixtures of trades, towns and collection waves.
Page builders, within WordPress only, with the spread behind each median
| Builder | Lower quartile | Median mobile Performance | Upper quartile | Mobile LCP | Websites |
|---|---|---|---|---|---|
| Elementor | 55 | 60 | 67 | 9.0s | 2,978 |
| Divi | 51 | 59 | 66 | 8.3s | 1,311 |
| WPBakery | 50 | 57 | 62 | 10.5s | 951 |
| Beaver Builder | 56 | 61 | 66 | 8.7s | 397 |
| Oxygen | — | — | — | — | 97 |
| Bricks | — | — | — | — | 83 |
| WordPress, no third-party builder detected | 56 | 65 | 75 | 6.7s | 4,070 |
"WordPress, no third-party builder detected" is one residual cohort of 4,070 sites: every WordPress site where the detector found no third-party page builder, whether it reported nothing or reported WordPress's own block editor. It is not a product anyone chose, so it is listed last and not compared with the others (C13). Builders are not ranked. A row with an em dash had too few websites for a median; its sample size is still shown.
- Sample
- 9,887 WordPress websites with a mobile result, 32.4% of the 30,557 websites with a mobile result. Every other website is invisible to this table.
- Source
- Websites for Tradespeople, "The State of UK Trades Websites 2026", dataset 2026-09.2. Lighthouse lab results via the PageSpeed Insights API.
Read this figure with
These are laboratory measurementsSeverity: high
Every figure comes from one Lighthouse run of one page, under device emulation, at one moment. Laboratory results describe how a page behaved under controlled conditions. They are not measurements of what visitors experienced, and the thresholds used here are reference points for interpreting a lab run, not an assessment against any third-party programme or a claim about search rankings. The audits ran on Google's servers, which the provider says may be in North America, Europe or Asia and vary per request; which one ran each audit was not recorded.
Builder detection only covers WordPressSeverity: high
A site builder is only ever identified on WordPress sites, which are 23.4% of all domains in the dataset. Every other domain, including every domain where no CMS was detected at all, is invisible to the builder analysis. Builder figures describe a subset of the dataset and must never be read as market share across UK trades websites generally.
The residual builder cohort is not a chosen toolSeverity: high
Within WordPress, 4,213 domains (41.1%) carry no third-party page builder. They arrive in two ways: 3,347 where the detector reported nothing, and 866 where it reported WordPress's own block editor, and the split tracks the strength of the detector's fingerprint rather than anything about the site: of the block-editor rows, 866 came from a moderate detection and 0 from a strong one, against 184 and 3,163 for the rows where nothing was reported (builder-performance.json). The two are therefore one residual cohort, sites where nothing else was detected, rather than a group that selected a product, and the block-editor subset is never published as a cohort of its own. The residual is labelled "WordPress, no third-party builder detected", reported with its size and medians, shown outside the rank sequence, and never charted as a score.
A small number of audits returned only some categoriesSeverity: low
170 mobile and 140 desktop audits returned some category scores but not all, most often the static categories with no performance trace. They are counted in the denominator and contribute only the metrics they actually produced, so any given median may rest on slightly fewer rows than the cohort total. Each figure carries its own sample size.
Nothing was assigned: this is an observational studySeverity: high
Every business in this dataset chose its own platform, its own trade and its own town. The audit measured what already existed, there is no control group, no randomisation and no intervention. A gap between two cohorts is therefore a difference between the sites that sit in them, not a measure of what a platform did to a site. Businesses that pick one platform may differ from those that pick another in ways this dataset did not observe: what they spent, how old the site is, who built it. Every comparison here is reported as a difference between groups, and no figure in this study can say what would happen to a site that moved from one platform to another.
The dataset holds every website attempted, and almost no figure uses that as its denominatorSeverity: high
This dataset is every one of the 43,738 websites the study requested an audit for, including the 12,708 that returned no usable automated audit on either device. That is deliberate: an earlier version of this dataset held only the websites that returned a result, which made the failure rate look far lower than it was and quietly changed the population every share described. Keeping the failed attempts costs nothing in measurement, they carry no scores to average, and it makes the population honest. The consequence is that 43,738 is the number of websites attempted and almost never the right denominator. Every figure in this report is published with the number of websites that returned that particular measurement, and those counts differ from each other: 30,397 websites returned a mobile Performance score, 30,399 a mobile LCP, 30,557 at least one mobile category score. Read the n beside a figure, not the size of the dataset.
How the trades compare
Median mobile Performance by trade, in order of sample size rather than score. The table below is descriptive: it shows what each trade's websites did in this sample, and it is not a league table.
- No trade-level figure in this report was recalculated inside the two collection waves, so this section quotes none of them. That is a limit of the data rather than an oversight. Trade is the part of this dataset most entangled with the way it was gathered: the two waves covered different towns and different trades, so several trades exist almost entirely inside one of them and a wave test would compare a trade against itself.
- The trades are nothing like the same size, and the table keeps three tiers apart. 26 trades meet the report's 300-site threshold for ranking, although this section deliberately does not rank them by score. 35 trades hold at least 100 websites and carry a median. 2 fall below that and show their sample size alone. A trade of a few hundred websites and a trade of several thousand do not carry the same certainty, and the table shows the count beside every figure so the difference is visible.
- 2 of the trades large enough to order were collected almost entirely inside a single wave, so their medians are entangled with that wave's city set, collection design and other cohort differences. The table gives each trade's wave split, its WordPress share and its undetected-platform share in the same row as its median, because those are the mixtures a trade difference would have to be separated from before it could be called a trade difference.
- Trade labels are the source's own and are not merged. Carpenters and joiners are separate labels here, and so are gardeners and landscape gardeners; combining them would be an editorial judgement about trades rather than a correction to data. One consequence is visible in the table, where a label can sit below the reporting threshold while a close neighbour sits well above it.
- None of this attributes a score to a trade. A trade's websites differ from another's in platform mix, in who built them, in how old they are, in what the business needs to show, and in which towns and collection waves they were drawn from, none of which this study separated. And this is a seeded sample, so a figure in the table describes the websites of that trade in this sample and never that trade across the UK.
Differences between the trades are small relative to the spread of scores inside any one of them, and they co-vary with platform mix and collection wave, which we have not separated. No trade figure in this report was recalculated inside the collection waves, so the table below is descriptive and nothing in it is quoted as a finding. The chart is ordered by sample size, not by score.
Median mobile Performance score by trade, in order of sample size
Median mobile Performance. 26 of 26 cohorts are drawn as bars. Values run from 63 (Kitchen Fitters) to 72 (Handyman Services). The axis runs from 0 to 100, and a longer bar is a better result.
- Plumbers68
n = 4,761
- Driveways66
n = 1,528
- Roofers67
n = 1,394
- Electricians68
n = 1,341
- Window Cleaners68
n = 1,257
- Builders67
n = 1,167
- Flooring Services65
n = 946
- Painters And Decorators69
n = 908
- Joiners67
n = 872
- Kitchen Fitters63
n = 791
- Domestic Cleaners69
n = 736
- Gas Engineers66
n = 733
- Gardeners67
n = 645
- Double Glazing64
n = 607
- Tree Surgeons66
n = 597
- Locksmiths68
n = 590
- Glaziers65
n = 583
- Carpet Cleaners69
n = 537
- Scaffolders66
n = 530
- Plasterers68
n = 512
- Bathroom Fitters65
n = 483
- Garage Doors66
n = 429
- Pest Control66
n = 392
- Washing Machine Repairs69
n = 373
- Handyman Services72
n = 370
- Fencing Contractors66
n = 335
- Sample
- 26 trades with a large enough sample to compare, ordered by how many websites each has, not by score. Each trade's median mobile LCP is in the table.
- Source
- Websites for Tradespeople, "The State of UK Trades Websites 2026", dataset 2026-09.2. Lighthouse lab results via the PageSpeed Insights API.
Read this figure with
Two crawl waves with different audit-failure ratesSeverity: high
The audit ran in two near-disjoint waves: 23,525 domains between 30 July and 5 August 2026 across 183 towns and cities, and 20,213 between 30 August and 1 September 2026 across 18 large cities, with only a handful of domains appearing in both. Its mobile audit-failure rate is 30.8% against 29.6%, the share of its domains with no detectable platform is 56.7% against 54.9%, and among those undetected domains the failure rate is 53.0% against 49.9%. The waves therefore differ in date, city set, trade mix and list quality at once, so a gap between them cannot be told apart from the way the data was collected, and it must not be read as a difference between the websites. Platform share is the figure most exposed: it is quoted as a share of the sites that could be identified, with both wave figures beside the pooled one (cms-share.json). Every pooled figure is tested against the wave split before publication; see wave-sensitivity.json.
Trade labels are the source's, unmerged, and 17.7% are absentSeverity: medium
7,740 domains carry no trade label in the source; they are reported as their own cohort rather than dropped or reassigned. Related labels that a reader might expect to be combined, carpenters and joiners, gardeners and landscape gardeners, are kept separate, because merging them is an editorial judgement about trades rather than a correction to the data.
Nothing was assigned: this is an observational studySeverity: high
Every business in this dataset chose its own platform, its own trade and its own town. The audit measured what already existed, there is no control group, no randomisation and no intervention. A gap between two cohorts is therefore a difference between the sites that sit in them, not a measure of what a platform did to a site. Businesses that pick one platform may differ from those that pick another in ways this dataset did not observe: what they spent, how old the site is, who built it. Every comparison here is reported as a difference between groups, and no figure in this study can say what would happen to a site that moved from one platform to another.
Trade is confounded with wave, city set and platform mixSeverity: high
Across the 26 trades large enough to rank, the share of a trade's sites collected in the first wave runs from 14.0% to 98.6%, 2 trades are drawn at least 90% from a single wave, and the waves differ in city coverage, audit-failure rate and seed-list quality (C2). The share of sites on WordPress runs from 21.7% to 46.5% and the share with no detectable platform from 32.3% to 48.5%, and platforms differ in median mobile Performance (cms-performance.json). A difference between two trades is therefore a difference between two mixtures of towns, waves and platforms that this study has not separated. The spread of trade medians (63 to 72) is also small beside the spread within a trade: the pooled interquartile range of the same score is 58 to 81. Trade exhibits are ordered by sample size rather than by score, the table is not a league table, and this study does not measure why any trade's sites score as they do.
The dataset holds every website attempted, and almost no figure uses that as its denominatorSeverity: high
This dataset is every one of the 43,738 websites the study requested an audit for, including the 12,708 that returned no usable automated audit on either device. That is deliberate: an earlier version of this dataset held only the websites that returned a result, which made the failure rate look far lower than it was and quietly changed the population every share described. Keeping the failed attempts costs nothing in measurement, they carry no scores to average, and it makes the population honest. The consequence is that 43,738 is the number of websites attempted and almost never the right denominator. Every figure in this report is published with the number of websites that returned that particular measurement, and those counts differ from each other: 30,397 websites returned a mobile Performance score, 30,399 a mobile LCP, 30,557 at least one mobile category score. Read the n beside a figure, not the size of the dataset.
View as a table
| Trade | Mobile Performance | Middle half | Mobile LCP | Websites | Collected in wave 1 | On WordPress | No platform detected |
|---|---|---|---|---|---|---|---|
| Trade not recorded | 67 | 58, 81 | 6.9s | 5,286 | 100% | 32% | 35% |
| Plumbers | 68 | 58, 83 | 6.2s | 4,761 | 98% | 32% | 43% |
| Driveways | 66 | 57, 80 | 7.3s | 1,528 | 99% | 31% | 34% |
| Roofers | 67 | 58, 82 | 7.0s | 1,394 | 45% | 31% | 37% |
| Electricians | 68 | 59, 82 | 6.1s | 1,341 | 29% | 30% | 43% |
| Window Cleaners | 68 | 58, 84 | 6.2s | 1,257 | 20% | 32% | 41% |
| Builders | 67 | 58, 79 | 7.1s | 1,167 | 37% | 30% | 38% |
| Flooring Services | 65 | 56, 79 | 7.3s | 946 | 26% | 36% | 39% |
| Painters And Decorators | 69 | 59, 84 | 6.4s | 908 | 20% | 27% | 39% |
| Joiners | 67 | 58, 79.5 | 6.9s | 872 | 21% | 27% | 38% |
| Kitchen Fitters | 63 | 54, 76 | 7.5s | 791 | 24% | 37% | 38% |
| Domestic Cleaners | 69 | 58, 84 | 6.0s | 736 | 17% | 26% | 45% |
| Gas Engineers | 66 | 57, 79 | 6.5s | 733 | 22% | 33% | 41% |
| Gardeners | 67 | 58, 81 | 7.0s | 645 | 26% | 29% | 39% |
| Double Glazing | 64 | 54, 73 | 7.5s | 607 | 14% | 46% | 33% |
| Tree Surgeons | 66 | 57, 75 | 7.2s | 597 | 26% | 40% | 32% |
| Locksmiths | 68 | 57, 84 | 6.0s | 590 | 15% | 34% | 47% |
| Glaziers | 65 | 56, 75 | 7.3s | 583 | 20% | 39% | 33% |
| Carpet Cleaners | 69 | 59, 86 | 5.7s | 537 | 25% | 34% | 46% |
| Scaffolders | 66 | 57, 78 | 7.5s | 530 | 28% | 38% | 32% |
| Plasterers | 68 | 60, 81 | 6.4s | 512 | 30% | 30% | 35% |
| Bathroom Fitters | 65 | 56, 77 | 6.9s | 483 | 26% | 35% | 38% |
| Garage Doors | 66 | 56, 80 | 7.2s | 429 | 27% | 37% | 37% |
| Pest Control | 66 | 56, 80 | 6.8s | 392 | 19% | 38% | 39% |
| Washing Machine Repairs | 69 | 57, 85 | 5.7s | 373 | 36% | 22% | 49% |
| Handyman Services | 72 | 60, 87 | 5.0s | 370 | 35% | 29% | 40% |
| Fencing Contractors | 66 | 57, 75.5 | 7.4s | 335 | 24% | 32% | 34% |
| Tilers | 68 | 58, 86 | 6.5s | 279 | 36% | 24% | 47% |
| Damp Proofing | 65 | 56, 79 | 7.1s | 274 | 33% | 35% | 37% |
| Guttering Services | 68 | 59, 78.8 | 6.3s | 254 | 23% | 35% | 32% |
| Boiler Repairs | 68 | 56, 86.3 | 6.1s | 204 | 38% | 33% | 48% |
| Landscape Gardeners | 66 | 56.5, 77 | 7.0s | 200 | 35% | 35% | 38% |
| Chimney Sweeps | 66 | 59, 79 | 6.5s | 199 | 23% | 33% | 34% |
| Bricklayers | 70 | 57, 88 | 6.1s | 174 | 34% | 32% | 43% |
| Loft Conversions | 65 | 57.5, 82.5 | 6.7s | 172 | 27% | 35% | 42% |
| Tarmac Contractors | — | , | — | 60 | 62% | 35% | 33% |
| Carpenters | — | , | — | 38 | 68% | 29% | 50% |
10 trades had too few websites to rank: those with at least 100 websites show their medians, the rest their sample size only. "Trade not recorded" (5,286 websites) is listed but is not a trade, so it is never compared. 2 trades were collected at least 90% in a single wave (Plumbers, Driveways), so their medians inherit that wave's city set and list quality (C2). Middle half is the range between the lower and upper quartile of the trade's mobile Performance scores. Descriptive, pooled, and not wave-tested: across the 26 trades large enough to place in an order, these medians run from 63 to 72, a spread of 9 points. The middle half of all websites with a mobile Performance score, whatever their trade, runs from 58 to 81, a range of 23 points. The gap between trades is the smaller of the two.
Is there a difference between cities?
Every city with enough measured websites to report, with its sample size. They are not ranked, and the table sits collapsed beneath the note for anyone who wants to look up their own.
- No city-level figure in this report was recalculated inside the collection waves, so this section quotes none of them. The pipeline also declines to rank cities at all, whatever their sample size, and records that decision in the data rather than leaving it to the writing: the reason given is that the medians span too narrow a range for an order to mean anything.
- In the pooled descriptive table, that narrowness is the main pattern. Where a city has enough measured websites to carry a median at all, the medians sit close together, and they sit closest among the cities with the largest samples, the ones where a real difference would be easiest to see. The figures are in the table; the point is that there is no city story in this dataset to tell.
- The sample sizes were set by the collection design, not by the towns. 53 cities have at least 100 measured websites and carry a median; 75 more are listed with their sample size alone; and 56 cities fall below 30 websites and are not listed at all, together holding 786 websites. Only 16 cities reach 300 measured websites, and the cohorts below them are a fraction of that size rather than a gentle slope.
- The two collection waves covered very different places, 183 towns and cities in the first and 18 in the second, so most of the smaller cohorts here come from one wave only and carry that wave's collection design with them. A city's median also carries its own mix of trades and platforms, which is why the table shows the WordPress share and the audit-failure rate beside each figure.
- Nothing here shows that location explains how a website performs. Nobody was assigned a town. A city cohort is the businesses a seeded search happened to find there, with their own trades, platforms and websites, so a difference between two cities in this table is a difference between those two sets of websites and nothing more. It is not a regional result, and this sample cannot support one.
Across the 53 cities with enough measured websites to report, the median mobile Performance scores sit close together, and they sit closest among the best-sampled cities. We have not ranked them, because a table ordered on a difference that small would present noise as a result, and no city figure was tested across the collection waves. The figures are in the table below, with the range stated beneath it.
Every city with at least 30 measured websites
Show every city with at least 30 measured websites
| City | Mobile Performance | Mobile LCP | On WordPress | Audit failed | Websites |
|---|---|---|---|---|---|
| London | 67 | 6.8s | 31% | 25% | 2,414 |
| Manchester | 67 | 6.4s | 33% | 29% | 2,026 |
| Birmingham | 67 | 6.7s | 33% | 31% | 1,754 |
| Leeds | 67 | 6.6s | 34% | 31% | 1,520 |
| Bristol | 66 | 6.9s | 34% | 29% | 1,341 |
| Glasgow | 67 | 6.6s | 30% | 31% | 1,341 |
| Liverpool | 69 | 6.3s | 31% | 32% | 1,267 |
| Newcastle upon Tyne | 67 | 6.7s | 32% | 31% | 1,192 |
| Sheffield | 66 | 6.7s | 30% | 30% | 1,166 |
| Nottingham | 67 | 6.7s | 32% | 31% | 1,153 |
| Southampton | 67 | 6.7s | 35% | 30% | 1,107 |
| Edinburgh | 66 | 6.9s | 33% | 30% | 1,018 |
| Leicester | 67 | 6.7s | 32% | 32% | 942 |
| Norwich | 66 | 6.9s | 31% | 29% | 825 |
| Cardiff | 67 | 6.4s | 30% | 33% | 818 |
| Belfast | 65 | 7.5s | 35% | 32% | 712 |
| Brighton | 65 | 7.1s | 36% | 23% | 223 |
| Exeter | 66 | 7.3s | 32% | 30% | 198 |
| Aylesbury | 66 | 7.1s | 37% | 29% | 197 |
| Altrincham | 64 | 7.7s | 41% | 15% | 194 |
| Guildford | 66 | 7.0s | 39% | 25% | 192 |
| Bournemouth | 62 | 7.4s | 43% | 24% | 185 |
| Reading | 67 | 6.6s | 32% | 30% | 167 |
| Coventry | 66 | 6.4s | 34% | 29% | 162 |
| Crawley | 66 | 7.0s | 32% | 28% | 152 |
| Plymouth | 69 | 6.3s | 28% | 23% | 152 |
| Bath | 66 | 7.5s | 37% | 30% | 151 |
| Basildon | 66 | 7.5s | 32% | 33% | 135 |
| Maidstone | 67.5 | 6.8s | 30% | 27% | 135 |
| Crewe | 69.5 | 6.4s | 28% | 30% | 126 |
| Ipswich | 69 | 6.4s | 30% | 29% | 126 |
| Bedford | 65 | 7.8s | 29% | 31% | 124 |
| Newcastle | 68 | 6.5s | 33% | 32% | 123 |
| Luton | 65 | 7.2s | 26% | 30% | 121 |
| Ashford | 68 | 6.8s | 32% | 25% | 119 |
| Bradford | 66 | 6.2s | 37% | 30% | 119 |
| Chelmsford | 63 | 8.2s | 36% | 27% | 119 |
| Barnsley | 65.5 | 7.3s | 30% | 30% | 116 |
| Chichester | 68 | 6.2s | 37% | 35% | 116 |
| Darlington | 66 | 7.4s | 27% | 35% | 113 |
| Portsmouth | 69 | 6.5s | 28% | 29% | 112 |
| Harlow | 65 | 7.3s | 40% | 29% | 110 |
| Hull | 69 | 6.4s | 27% | 26% | 109 |
| Peterborough | 71 | 4.9s | 30% | 27% | 109 |
| Eastbourne | 66 | 7.1s | 31% | 24% | 108 |
| Barry | 64.5 | 7.4s | 25% | 35% | 106 |
| Chester | 65 | 6.3s | 24% | 33% | 106 |
| Colchester | 68 | 6.3s | 31% | 32% | 106 |
| Burton upon Trent | 68 | 6.3s | 32% | 28% | 103 |
| Cambridge | 68 | 6.6s | 31% | 24% | 102 |
| Cheltenham | 69 | 6.8s | 39% | 33% | 102 |
| Coatbridge | 66 | 7.8s | 38% | 32% | 102 |
| Gloucester | 68 | 6.1s | 28% | 28% | 100 |
| Blackburn | — | — | 29% | 34% | 98 |
| Salisbury | — | — | 39% | 34% | 98 |
| Kidderminster | — | — | 30% | 29% | 94 |
| Bury St Edmunds | — | — | 33% | 28% | 91 |
| Slough | — | — | 41% | 38% | 91 |
| Lincoln | — | — | 42% | 33% | 90 |
| Blackpool | — | — | 38% | 36% | 87 |
| Northampton | — | — | 33% | 25% | 86 |
| Derby | — | — | 30% | 29% | 84 |
| Bolton | — | — | 39% | 33% | 83 |
| Dunfermline | — | — | 33% | 33% | 83 |
| Aberdeen | — | — | 23% | 24% | 81 |
| Oxford | — | — | 36% | 35% | 81 |
| Corby | — | — | 28% | 32% | 80 |
| Shrewsbury | — | — | 27% | 31% | 77 |
| Lichfield | — | — | 25% | 28% | 76 |
| Durham | — | — | 23% | 33% | 75 |
| Chesterfield | — | — | 31% | 24% | 74 |
| Dundee | — | — | 27% | 27% | 74 |
| Stevenage | — | — | 38% | 21% | 74 |
| Newport | — | — | 33% | 28% | 73 |
| Watford | — | — | 29% | 16% | 73 |
| Canterbury | — | — | 31% | 31% | 71 |
| High Wycombe | — | — | 39% | 28% | 70 |
| Hertford | — | — | 28% | 31% | 68 |
| Doncaster | — | — | 48% | 40% | 66 |
| Preston | — | — | 39% | 35% | 66 |
| Hemel Hempstead | — | — | 30% | 38% | 64 |
| Middlesbrough | — | — | 38% | 33% | 64 |
| Flint | — | — | 20% | 36% | 60 |
| Wrexham | — | — | 41% | 26% | 59 |
| Bangor | — | — | 21% | 37% | 57 |
| Swansea | — | — | 24% | 33% | 55 |
| Carlisle | — | — | 26% | 18% | 54 |
| Wolverhampton | — | — | 44% | 36% | 54 |
| Hereford | — | — | 30% | 30% | 53 |
| Southend-on-Sea | — | — | 33% | 31% | 52 |
| Great Yarmouth | — | — | 27% | 30% | 51 |
| Stirling | — | — | 16% | 22% | 51 |
| Bridgend | — | — | 26% | 38% | 50 |
| Kings Lynn | — | — | 33% | 36% | 49 |
| Swindon | — | — | 39% | 27% | 49 |
| Worcester | — | — | 35% | 37% | 49 |
| Grantham | — | — | 27% | 34% | 48 |
| Llanelli | — | — | 38% | 32% | 48 |
| Ayr | — | — | 23% | 34% | 43 |
| Telford | — | — | 35% | 27% | 43 |
| Barrow-In-Furness | — | — | 33% | 33% | 42 |
| Folkestone | — | — | 29% | 28% | 41 |
| Kettering | — | — | 39% | 27% | 41 |
| Macclesfield | — | — | 44% | 32% | 41 |
| Stockport | — | — | 37% | 34% | 41 |
| York | — | — | 29% | 29% | 41 |
| Leamington Spa | — | — | 28% | 26% | 40 |
| Grimsby | — | — | 36% | 39% | 39 |
| Sunderland | — | — | 31% | 33% | 39 |
| Huddersfield | — | — | 32% | 31% | 38 |
| Caerphilly | — | — | 16% | 24% | 37 |
| Milton Keynes | — | — | 30% | 35% | 37 |
| Penzance | — | — | 32% | 14% | 37 |
| Scunthorpe | — | — | 30% | 34% | 37 |
| Ballymena | — | — | 36% | 28% | 36 |
| Stafford | — | — | 44% | 40% | 36 |
| Bangor North Wales | — | — | 20% | 34% | 35 |
| Boston | — | — | 29% | 41% | 35 |
| Greenock | — | — | 29% | 40% | 35 |
| Medway | — | — | 31% | 36% | 35 |
| Kilmarnock | — | — | 35% | 39% | 34 |
| Inverness | — | — | 24% | 30% | 33 |
| Oldham | — | — | 42% | 40% | 33 |
| Armagh | — | — | 34% | 20% | 32 |
| Halifax | — | — | 32% | 35% | 31 |
| Redditch | — | — | 42% | 31% | 31 |
| Wakefield | — | — | 23% | 43% | 31 |
| Knutsford | — | — | 33% | 38% | 30 |
A city shows an em dash where it has fewer than 100 measured websites; its sample size is still shown. 56 further cities, covering 786 websites, had fewer than 30 and are not listed. Descriptive, pooled, and not wave-tested: across these 53 cities the medians run from 62 to 71, a range of 9 points, and both ends of that range are small cohorts. Among the 16 cities with at least 300 measured websites the medians are closer still. Sample sizes were set by the collection design rather than by the towns: 16 cities clear 300 measured websites and the next largest cohorts are a fraction of that size. WordPress share and audit-failure rate are shown because a city's median carries its own mix of platforms and of websites that returned nothing.
- Sample
- 53 cities with a published figure; 75 more listed with their sample size only, because they have fewer than 100 measured websites; 56 cities with fewer than 30 are not listed
- Source
- Websites for Tradespeople, "The State of UK Trades Websites 2026", dataset 2026-09.2. Lighthouse lab results via the PageSpeed Insights API.
Read this figure with
Two crawl waves with different audit-failure ratesSeverity: high
The audit ran in two near-disjoint waves: 23,525 domains between 30 July and 5 August 2026 across 183 towns and cities, and 20,213 between 30 August and 1 September 2026 across 18 large cities, with only a handful of domains appearing in both. Its mobile audit-failure rate is 30.8% against 29.6%, the share of its domains with no detectable platform is 56.7% against 54.9%, and among those undetected domains the failure rate is 53.0% against 49.9%. The waves therefore differ in date, city set, trade mix and list quality at once, so a gap between them cannot be told apart from the way the data was collected, and it must not be read as a difference between the websites. Platform share is the figure most exposed: it is quoted as a share of the sites that could be identified, with both wave figures beside the pooled one (cms-share.json). Every pooled figure is tested against the wave split before publication; see wave-sensitivity.json.
A seeded city sample, not a representative sample of the UKSeverity: high
Sampling was seeded on a set of major cities: 16 cities contribute several hundred domains each, while the remainder form a long tail. The dataset is large, but it is not a random or weighted sample of UK trades businesses, and no figure here should be read as a national estimate. It describes the 31,030 audited websites in this dataset.
Cities are reported but not rankedSeverity: medium
City-level medians are published in full, with sample sizes, but no city league table is produced. The spread between cities is too narrow relative to the sample to support an ordering, and a ranked table would present noise as a result.
Nothing was assigned: this is an observational studySeverity: high
Every business in this dataset chose its own platform, its own trade and its own town. The audit measured what already existed, there is no control group, no randomisation and no intervention. A gap between two cohorts is therefore a difference between the sites that sit in them, not a measure of what a platform did to a site. Businesses that pick one platform may differ from those that pick another in ways this dataset did not observe: what they spent, how old the site is, who built it. Every comparison here is reported as a difference between groups, and no figure in this study can say what would happen to a site that moved from one platform to another.
The dataset holds every website attempted, and almost no figure uses that as its denominatorSeverity: high
This dataset is every one of the 43,738 websites the study requested an audit for, including the 12,708 that returned no usable automated audit on either device. That is deliberate: an earlier version of this dataset held only the websites that returned a result, which made the failure rate look far lower than it was and quietly changed the population every share described. Keeping the failed attempts costs nothing in measurement, they carry no scores to average, and it makes the population honest. The consequence is that 43,738 is the number of websites attempted and almost never the right denominator. Every figure in this report is published with the number of websites that returned that particular measurement, and those counts differ from each other: 30,397 websites returned a mobile Performance score, 30,399 a mobile LCP, 30,557 at least one mobile category score. Read the n beside a figure, not the size of the dataset.
What the data suggests
Six things the evidence in this report supports, and the readings it does not. Every figure here has appeared above with the number of websites behind it, and every one was recalculated inside both collection waves before it was published.
- The clearest repeated device gap in this dataset is on mobile performance, and it is consistent rather than occasional. On the 29,965 websites that returned a Performance score on both devices, 87.5% scored lower under the mobile strategy, a median of 18 points apart. On the 29,969 that returned an LCP on both, 99.5% recorded a higher one on mobile, a median of 5.1 seconds apart. Those comparisons use the same listed URLs under both strategies rather than two separate populations, which makes them stronger evidence of a within-site device difference than comparing independent mobile and desktop medians. The URL each request finally resolved to after redirects was not retained.
- The picture is dominated by a large middle rather than a small extreme tail. Half the 30,399 websites with a mobile LCP took 6.7 seconds or more, and 72.5% took over 4 seconds. Sorted into Lighthouse's own bands, 15.7% of the 30,397 websites with a mobile Performance score sit in the top band and 10.7% in the bottom one, 73.6% are in between. A reader looking for a scandal at the bottom of the table will miss where most of these websites actually are.
- Read a Lighthouse score comparatively, and as a laboratory result. Each measurement comes from one automated test of one listed URL, and the conditions the service applied were not recorded. It is not a measurement of what any visitor experienced, and it is not a judgement passed by a search engine. What it supports is comparison between websites collected through the same request pattern inside the same five-week window, which is how this report uses it.
- Platform is associated with a difference here, and this study cannot say what produced it. Among the websites whose platform we identified, the median mobile Performance score is 61 for WordPress (9,869 websites) and 69 for Wix (5,031); restricted to strong fingerprints it is 60 (8,374) against 67 (3,841); and in every one of the 12 trades with enough websites on both sides, the WordPress group is the lower of the two. The direction survives holding the trade constant, which is why the difference does not appear to be explained by trade mix alone. Why it is there at all is a question this dataset was never able to ask: nothing was assigned, and the businesses that choose each platform differ in ways it did not observe.
- A label is not a verdict on any individual website. The pooled descriptive tables show substantial variation within platform, builder and trade groups, with overlapping interquartile ranges. That is why their medians should not be treated as clean dividing lines between individual websites. The residual group of WordPress websites where no third-party builder was recognised is not a product and carries no recommendation either. The trade and city chapters are descriptive: no trade- or city-level performance measurement was wave-tested, so those pooled tables are not used to support claims about which trade or town performs better.
- What returned nothing is part of the evidence. 12,708 of the 43,738 websites attempted, 29.1%, produced no usable automated audit on either device. They are kept in the dataset rather than quietly dropped, because removing them would have made every failure rate look better and quietly narrowed the population every share describes. A failed automated audit is not evidence of a broken website, and the retained data does not establish why any individual page could not be measured.
What not to take from this
- Not that these websites are bad. Lighthouse bands are Lighthouse's names for ranges of its own score, and most of these websites sit in the middle one.
- Not that one platform is faster than another as a property of the platform. The difference is between groups of websites that chose their own platforms.
- Not that visitors on a phone wait the gap we measured. These are two laboratory tests of the same listed address, not two audiences.
- Not that location does or does not matter. The city table is descriptive and the sample was seeded on a set of towns, so it can neither support a regional result nor rule one out.
- Not that any of this describes UK trades businesses as a whole. It describes the websites in this sample.
Methodology
How the sample was gathered, how each figure was calculated, and the decisions taken along the way. What was recorded about the conditions each audit ran under, and what was not, is set out in full beneath this.
- Websites were found through business listings on a UK online business directory, searched by trade and by town. Each listing's website field was reduced to a bare domain and de-duplicated, giving 43,738 websites, and every figure in this report describes some subset of those. Collection ran between 2026-07-30 and 2026-09-01 in two waves, which covered different towns and different trades; where a website was audited more than once, the most recent result is kept.
- Each website's listed URL was sent to Google's PageSpeed Insights API twice: once with its mobile strategy and once with its desktop strategy, asking for all four Lighthouse categories. The two results are kept independently, so a website that returned a mobile result and not a desktop one keeps the mobile one. Audits that returned some category scores and not others are kept too, contributing only the categories they produced. Attempts that returned nothing are kept in the dataset as missing measurements rather than deleted, which is why the failure rates in this report are rates rather than an absence.
- Platform detection was a separate request to each homepage, not part of the audit, and it recognises only the platforms it holds fingerprints for. Page-builder detection runs only inside WordPress. The trade and town attached to each website are the directory's own labels. Both are lowercased for grouping, and one trade spelling variant is mapped onto another, “roofer” is counted as “roofers”, which affects 116 of the websites attempted. Nothing else is mapped and no categories are combined: carpenters and joiners are separate labels here, as are gardeners and landscape gardeners. The published file carries each trade both as the directory recorded it and as normalised, so the mapping is visible rather than assumed.
- Medians are used throughout rather than averages, because the timing distributions have long right tails. Quantiles are computed by linear interpolation between the two nearest order statistics, the definition R calls type 7, and are pinned to that one method so a figure cannot move because a different convention was used. Every figure is published with the number of websites that returned that particular measurement, and those counts differ from one another. 43,738 is the number of websites attempted. It is not used as a default denominator for Performance, timing or Lighthouse-category measurements: each of those uses the number of websites that returned that specific measurement. Attempt- and coverage-level figures, how often an audit returned nothing, how often a platform could be identified, do use 43,738, because that is genuinely their denominator.
- Three sample-size thresholds decide what may be published. A cohort of fewer than 30 websites is not listed; below 100 it is listed with its sample size and no median; and only at 300 is it treated as large enough to place in an order at all. A controlled comparison, one platform inside one trade, needs 100 websites in each cell, and the median must clear that on its own sample rather than the cell's.
- One rule decides which analytical results this report states as findings. Every performance, comparative or distributional figure promoted into the writing was recalculated independently inside each of the two collection waves, and only those that held across both are quoted; anything untested, or tested and not holding, stays in a table and is labelled descriptive. That rule governs analytical results, not every number on the page: sample counts, the thresholds above, provenance and other deterministic facts about the dataset carry no wave verdict, because there is nothing about them to be robust to. It is why the trade and city chapters quote no measurement at all, no trade- or city-level performance figure was wave-tested, so both remain descriptive pooled tables.
- The published dataset carries a pseudonymous identifier for each website in place of its domain, and no domain, URL or business name. Where a town-and-trade combination described fewer than 5 websites, that value is withheld and marked. One row could not be protected that way, because neither its town nor its trade was ever recorded, so it is omitted from the download: the internal dataset holds 43,738 websites and the published file 43,737 rows. Every figure in this report is computed from the internal dataset, so no statistic is affected. This is dataset 2026-09.2, and its checksum is below.
Every figure in this report was produced by one analysis pipeline from a single frozen dataset, and one command regenerates every number here. Nothing on this page is typed in by hand.
What is published: the anonymised dataset, one row per website, and the methodology below it. What is not: the source dataset, because it names 43,738 real businesses, and with it the analysis pipeline and the detailed QA record, which we retain privately so any figure can be reproduced and checked on request. The source dataset’s SHA-256 is 7736a4183c00ed8f15a00d9e2f0f5a05…, so a copy can be confirmed as the one these figures came from.
Medians are used throughout rather than averages, because the distributions have long right tails and an average would follow the tail rather than the typical site. Every figure is published with the number of websites behind it. Cohorts too small to support a median are reported with their size and no figure, and are never placed in a league table.
Platform detection records how firmly it recognised a platform, from the fingerprint it found in the page’s own markup: a strong fingerprint is an unambiguous match, a moderate one a weaker signal. That strength is not assumed to be distributed at random across the websites, and the two strata do not behave alike, so every platform comparison in this report is made twice, once across all identified websites and once within strong fingerprints only, and is reported with the platform caveat attached. A difference that appeared only in the weaker stratum would not be quoted as a difference between platforms.
Why these figures differ from field-data studies
- Other public studies of website speed report Largest Contentful Paint from Google's Chrome User Experience Report, and often report figures a good deal faster than the ones here. The two are not competing measurements of the same thing, and neither is a correction of the other.
- This study is laboratory data. Every figure comes from one automated Lighthouse test of one listed URL, run twice through the PageSpeed Insights API — once with its mobile strategy and once with its desktop strategy — under conditions the service applied and did not report back to us.
- The Chrome User Experience Report is field data. Google describes it as “a dataset that reflects how real-world Chrome users experience popular destinations on the web”, collected from real browsers according to browser settings that determine which users are eligible.
- They also need not describe the same websites. Google states that not all origins or pages are represented in that dataset, and that the eligibility criteria require a page to be publicly discoverable and to have “a large enough number of visitors in order to create a statistically significant dataset”; the exact threshold is not published. This study is a long tail of local trades businesses, and it made no attempt to establish which of them meet that bar.
- So a difference between the two is expected rather than surprising. A laboratory test and an aggregate of real visits measure different things, over populations that need not overlap. Nothing in this report says what these websites would look like measured in the field, because this study did not measure that.
Chrome UX Report overview (Google), page dated 2024-02-08, read 2026-09-02; Chrome UX Report methodology (Google), page dated 2024-06-20, read 2026-09-02
How the audits were run
The collector stored only the four category scores and six metric values from each PageSpeed Insights response, so most of the Lighthouse configuration that produced this dataset was never kept. Each condition below is marked retained, partly retained or not retained. Where a condition was not retained, what Google publishes about its service is given separately, with the page and the date it was read; that is what the provider says its service does, not an observation of these audits. Nothing is inferred to fill a gap.
- Audit provider and requestRetained
- Every audit was one request to Google's PageSpeed Insights API (version 5, runPagespeed) asking for the Performance, Accessibility, Best Practices and SEO categories, with a 90-second timeout on the collector's side. The collector kept only the four category scores and six metric values (largest contentful paint, cumulative layout shift, total blocking time, first contentful paint, speed index, time to interactive) from each response. Apart from the HTTP status of a failed response, and on a 400 the first 80 characters of the API's own error message, both kept as the row's error value, no other part of the response was stored.PageSpeed Insights API v5 reference, runPagespeed (Google), page dated 2024-09-03, read 2026-09-02
- Lighthouse versionNot retained
- The Lighthouse version that produced each audit was not retained: the collector discarded that field of every response. Google's release notes for the service record an update to Lighthouse 13.0 on 20 October 2025 and carry no later entry (page last updated 27 October 2025, read 2 September 2026), but those notes do not record every point release, and the check run on 2 September 2026 came back as Lighthouse 13.4.1, a version the notes never mention. So the audits ran on some 13.x release and nothing recorded which. Neither the release notes nor the September check is an observation of the July to September audits, and a Lighthouse point release can change how a score is calculated.PageSpeed Insights release notes (Google), page dated 2025-10-27, read 2026-09-02
- Form factor and device emulationPartly retained
- Each website was requested once with strategy=mobile and once with strategy=desktop, and the mobile and desktop columns in the dataset are those two requests. Which emulated device and screen Google applied under each strategy was not retained. Google describes the mobile test as 'a mid-tier device (Moto G4) device on a mobile network' and the desktop test as 'an emulated-desktop with a wired connection'. The Lighthouse 13.4.1 source sets the mobile screen at 412 by 823 pixels at 1.75x scale and the desktop screen at 1350 by 940 at 1x. The check run on 2 September 2026 returned mobile screenshots 412 pixels wide and desktop screenshots 1,335 to 1,350 pixels wide, and a 'moto g power (2022)' Chrome user agent for mobile. That is what the runner returns now, not an observation of the July to September audits.About PageSpeed Insights (Google), page dated 2024-10-21, read 2026-09-02; Lighthouse v13.4.1 source: core/config/constants.js (screen emulation, user agents, default throttling method), read 2026-09-02; PageSpeed Insights API v5 reference, runPagespeed (Google), page dated 2024-09-03, read 2026-09-02
- Throttling methodNot retained
- Not retained, and not returned by the API: the configSettings block of a PageSpeed Insights response carries only the form factor, locale, channel and category list, with no throttling settings at all, so a collector that kept every response in full would still not hold this value. Google describes the service as analysing pages 'in a simulated environment'; Lighthouse's default throttling method is 'simulate', and its documentation says that setup 'matches the setup of PageSpeed Insights'. If that is what ran here, the timing figures are model estimates for a target connection rather than load times measured over a real one, but that is the provider describing its service, and no throttling setting was recorded for any audit in this dataset.PageSpeed Insights API v5 reference, runPagespeed (Google), page dated 2024-09-03, read 2026-09-02; About PageSpeed Insights (Google), page dated 2024-10-21, read 2026-09-02; Lighthouse v13.4.1 source: core/config/constants.js (screen emulation, user agents, default throttling method), read 2026-09-02; Lighthouse v13.4.1 documentation: docs/throttling.md, read 2026-09-02
- CPU slowdownNot retained
- Not retained, and not returned by the API. Google's release notes record that on 5 December 2024 'the CPU throttling factor for PageSpeed Insights has been adjusted to account for the low CPU performance benchmarks typical in PageSpeed Insights production environments'. The Lighthouse 13.4.1 preset for the hosted mobile service sets a 1.2x CPU slowdown multiplier; the hosted desktop preset selects the 'desktopDense4G' profile, whose multiplier is 1x, meaning no CPU slowdown. These are the provider's published settings, not values observed in this collection. The generic Lighthouse command-line default of 4x is a different setting and does not describe the hosted service.PageSpeed Insights release notes (Google), page dated 2025-10-27, read 2026-09-02; Lighthouse v13.4.1 source: core/config/lr-mobile-config.js (the hosted-service mobile preset), read 2026-09-02; Lighthouse v13.4.1 source: core/config/lr-desktop-config.js (the hosted-service desktop preset), read 2026-09-02; Lighthouse v13.4.1 documentation: docs/throttling.md, read 2026-09-02
- Network conditionsNot retained
- Not retained, and not returned by the API. Lighthouse's documentation gives its simulated mobile network throttling as 150 ms latency and 1.6 Mbps down / 750 Kbps up with no packet loss; separately, and about the throttling method rather than those numbers, it says simulated throttling 'matches the setup of PageSpeed Insights'. The hosted desktop preset names a 'desktopDense4G' profile. These are the provider's published settings for its own tooling, not values observed in this collection.Lighthouse v13.4.1 documentation: docs/throttling.md, read 2026-09-02; Lighthouse v13.4.1 source: core/config/lr-desktop-config.js (the hosted-service desktop preset), read 2026-09-02
- Where the audit ranNot retained
- Where Google ran each audit was not recorded. Google states that the test 'runs in a Google datacenter that can vary based on network conditions' and reports 'one of: North America, Europe, or Asia', so audits in this dataset may have run from different regions. The collector that sent the requests was run by the publisher from one machine in the UK; that is the operator's account of the run, not a value stored with the data.About PageSpeed Insights (Google), page dated 2024-10-21, read 2026-09-02
- Runs per websiteRetained
- One request per strategy per run, with no automatic retry. Where the API answered with a rate-limit response the row was dropped and the website was requested again in a later run, so some websites were requested more than once; five websites whose listed address carried a stray space after the scheme separator also slipped past the runner's 'already audited' check and were audited again on later runs. Where a domain has more than one row, the pipeline keeps the most recent (27 rows removed across 5 domains). Every figure in the report therefore rests on a single Lighthouse run per device, with the run-to-run variation a single run carries.
- Redirects and the audited URLPartly retained
- The address sent to the API was the website address as listed in the collector's source sheet, trimmed of whitespace. Google follows redirects and audits the page it arrives at; the final URL was not retained, so a row may describe a page other than the listed address, including a different host. The check run on 2 September 2026 showed this for one of the two websites checked: the API reported a redirect to a different host and a warning about it, neither of which the collector would have stored. The scheme in a listed address (http or https) is the source sheet's, not the scheme the page was finally served on, which is why the pipeline drops the listed address entirely.PageSpeed Insights API v5 reference, runPagespeed (Google), page dated 2024-09-03, read 2026-09-02
- Collection dates and timezonePartly retained
- Each row's 'Audited At' is the collector's local clock when the audit finished, stored without a timezone. The machine kept Europe/London time, and cross-checks against the collector's UTC-stamped session record place it at BST (UTC+01:00) throughout: the five retained run logs fix that offset at five points inside wave 2, and wave 1 rests on the session record alone, because no wave-1 run log survives. That is an inference from those checks, not a value in the data. Rows fall on seven local days: a 7-row test on 30 July 2026, wave 1 on 3 to 5 August (17,237 rows including the test), and wave 2 on 30 August to 1 September (15,491 rows). The pipeline emits every timestamp with an explicit +01:00 offset; nothing is converted.
- What an error value meansRetained
- An error value describes the collector's request to the API, not the website. 'Timed out' and 'connection error' mean the collector's own call to the API did not complete within 90 seconds or could not connect; the connection errors cluster in two short bursts, on 3 August 20:35 to 20:36 and on 30 August 15:05 to 15:09 and 15:24 to 15:25 (BST). 'HTTP 500' means the API answered with a server error whose body was not kept, so nothing is known about its cause. Where the API itself reported that it could not fetch, render or parse the page (its 400-class responses, labelled FAILED_DOCUMENT_REQUEST, NO_FCP or NOT_HTML), the collector wrote the row to a separate sheet: 11,037 of the 43,765 rows written across the two sheets (25.2%), 341 of which recorded no error on the other device and 331 of which carry a Performance score. Those rows are part of this dataset. An earlier version of it held only the audited sheet, which understated the failure rate and narrowed the population every share described; no script records how or when the two sheets were separated.
- Platform detectionPartly retained
- Platform detection (CMS and page builder) was a separate fetch of each homepage by the collector, with a 15-second timeout, redirects followed and the first 1 MB read. It was not part of the Lighthouse audit. For wave 2 it ran immediately before each website's audit; for wave 1 and the 30 July test it was back-filled in one session on 28 August 2026 (21:17 to 22:21 BST), 23 to 29 days after those audits. No per-row flag records which; rows audited before 28 August are the back-filled ones.
- Where the website list came fromPartly retained
- Websites were found through business listings on a UK online business directory, searched by the same tool. The tool's completion list records 756 trade-and-city pairs (35 trade categories in 16 cities, plus extended plumber and decorator searches), but it is a completion marker rather than a search log, so 756 is a floor: the data itself carries 848 distinct trade-and-city combinations. Each listing's website field was reduced to a bare domain and de-duplicated. The date each listing was collected and its position in the directory's results were not retained.
- How the dataset left the collectorRetained
- The dataset file is byte-identical to a CSV export of the collector's 'PSI Audit' sheet downloaded on 1 September 2026 at 18:58 BST (7,618,420 bytes, SHA-256 beginning c2441e07), and its 32 columns match the collector's column list exactly. The export wrote 5,510 timestamps with an unpadded hour, which the pipeline normalises. The 400-class rows were held in a second sheet, exported on 2 September 2026 (11,037 rows, SHA-256 beginning 4ecbf5aa); the two together are the dataset this study analyses. No script records how the two sheets came to be separated.
Checked on 2026-09-02
The collector's unchanged request code was run once more for one website from each wave, chosen as the smallest site identifier among websites scored on both devices in that wave, and this time the full API response was retained. Scores from the check were not compared with the original audits and are not used anywhere in this report.
The request code is byte-identical between the collector's only commit (31 July 2026, the day after the 7-row test of 30 July, and before the 3 to 5 August bulk of wave 1) and its working copy on 2 September 2026. No intermediate version is retained, so continuity in between rests on those two points and on the session record. That record shows the runner script being written and repeatedly edited during collection, including on 28 August 2026 to add the platform-detection fetch and on 30 August 2026 to add a skip list; none of the recorded edits touches the request code, but a session record can only evidence edits made inside a recorded session, and the runner is untracked, so no version of it survives from the collection window itself. The check shows what the runner does now; it is not evidence of the conditions that produced the dataset.
- Lighthouse 13.4.1 on all four responses.
- configSettings: formFactor and emulatedFormFactor 'mobile' or 'desktop' matching the strategy sent; locale en-US; channel 'lr'; onlyCategories performance, accessibility, best-practices, seo.
- No throttling settings, CPU multiplier, throttling method or screen-emulation block anywhere in the responses.
- Host user agent HeadlessChrome 151 on Linux x86_64; network user agent 'moto g power (2022)' Chrome 151 Mobile for mobile and Macintosh Chrome 151 for desktop.
- Full-page screenshots 412 pixels wide for mobile; 1,335 and 1,350 pixels wide for desktop.
- The unchanged parser produced all four category scores and six metric values for both devices of both websites.
- One website's listed address redirected to a different host; the API reported the final URL and a warning, which the collector would not have stored.
- The environment block carries no region or location.
The evidence behind each line, the collector source, the retained run logs and the sheet snapshots, is listed in the published methodology. The collection evidence itself names real businesses, so it is held privately and shown on request rather than published.
Limitations
What this dataset cannot tell you, stated once and in full. Each of these also appears beside the findings it affects rather than only here.
- The sample was seeded on a set of towns and trades and is not a random or weighted sample of UK trades businesses. No figure here is a national estimate.
- The two collection waves differ in date, town set and trade mix at once, so a difference between them cannot be separated from the way the data was gathered.
- Each website was audited once per device. A single automated run carries run-to-run variation, and a repeat of the same page can land elsewhere.
- The exact historical service-side emulation, network and throttling configuration was not fully retained in the dataset, and neither was the Lighthouse version that produced these figures. The test-conditions table records exactly which conditions were retained, partly retained and not retained.
- The URL each request finally resolved to after redirects was not retained, so a row may describe a page other than the address that was listed.
- Platform detection recognises a closed set of fingerprints, so “no platform identified” means the detector recognised nothing rather than that a website has no platform. Those websites are also disproportionately the ones that returned no measurement, so the undetected group is selected rather than random.
- The platform and builder comparisons are observational. Nothing was assigned, there is no control group, and the businesses choosing each platform differ in ways this study did not observe.
- The trade and city chapters are descriptive pooled analyses. No trade- or city-level performance measurement was wave-tested, and neither table supports a conclusion about which trade or town performs better.
- The Accessibility, Best Practices and SEO categories are limited to what Lighthouse can test automatically. A high Accessibility score is not an accessibility audit, and the SEO category is not a measure of search visibility.
- A failed automated measurement is not evidence of a broken website, and the retained data does not establish why any individual page could not be measured.
C1
Severity: High
The seed URL scheme cannot support an HTTPS claim
The source carries a Website URL column, but it records the URL as it appeared in the seed list rather than the URL that actually resolved. Its scheme therefore describes how the list was compiled, not whether a site serves HTTPS. The column is dropped from the canonical row entirely, and no HTTPS-adoption figure appears anywhere in this study.
Applies to every figure in this report.
C2
Severity: High
Two crawl waves with different audit-failure rates
The audit ran in two near-disjoint waves: 23,525 domains between 30 July and 5 August 2026 across 183 towns and cities, and 20,213 between 30 August and 1 September 2026 across 18 large cities, with only a handful of domains appearing in both. Its mobile audit-failure rate is 30.8% against 29.6%, the share of its domains with no detectable platform is 56.7% against 54.9%, and among those undetected domains the failure rate is 53.0% against 49.9%. The waves therefore differ in date, city set, trade mix and list quality at once, so a gap between them cannot be told apart from the way the data was collected, and it must not be read as a difference between the websites. Platform share is the figure most exposed: it is quoted as a share of the sites that could be identified, with both wave figures beside the pooled one (cms-share.json). Every pooled figure is tested against the wave split before publication; see wave-sensitivity.json.
Applies to every figure in this report.
C3
Severity: High
A seeded city sample, not a representative sample of the UK
Sampling was seeded on a set of major cities: 16 cities contribute several hundred domains each, while the remainder form a long tail. The dataset is large, but it is not a random or weighted sample of UK trades businesses, and no figure here should be read as a national estimate. It describes the 31,030 audited websites in this dataset.
Applies to every figure in this report.
C4
Severity: High
Sites with no detected CMS are partly sites the audit could not load
The mobile audit fails on 51.3% of domains with no detected CMS, against 3.4% where a platform was identified. Platform detection was a separate fetch of the homepage, not part of the audit, but the two are not independent for all that: a site that did not answer the detector could not be fingerprinted, and a site that did not answer one request often did not answer the other. The undetected cohort is therefore selected, not random, and every per-platform row carries both its sample size and its own audit-failure rate so the selection is visible beside the medians rather than in a footnote. Detection also ran at a different time from the audit for the earlier wave: see the platform-detection row of the test conditions.
Applies to: cms-share, cms-performance, builder-performance
C5
Severity: Low
The Source Tab column carries no information
Source Tab holds the same value on every row in the source and is dropped. It is recorded here so its absence reads as a decision rather than an oversight.
Applies to every figure in this report.
C6
Severity: Medium
Platform comparisons are repeated within strong fingerprints
In this dataset the CMS Confidence value "low" is exactly equivalent to an undetected CMS, the two counts match to the row, so on the undetected sites confidence is not a third level. It is collapsed into a detector strength that is null whenever no CMS was found, and that identity is re-proved on every pipeline run. On identified sites, the detector's confidence level is retained rather than discarded. Every platform comparison in this report is therefore made twice: once across all identified websites and once within strong fingerprints only, so the result can be checked without relying on the weaker identifications. Only platform differences that satisfy the report's wave-sensitivity rules are quoted as findings. Differences between fingerprint-confidence strata are not treated as findings in this report.
Applies to: cms-share, cms-performance, controlled-comparisons, confidence-coverage, wave-sensitivity
C7
Severity: High
These are laboratory measurements
Every figure comes from one Lighthouse run of one page, under device emulation, at one moment. Laboratory results describe how a page behaved under controlled conditions. They are not measurements of what visitors experienced, and the thresholds used here are reference points for interpreting a lab run, not an assessment against any third-party programme or a claim about search rankings. The audits ran on Google's servers, which the provider says may be in North America, Europe or Asia and vary per request; which one ran each audit was not recorded.
Applies to every figure in this report.
C8
Severity: Medium
Time to Interactive largely restates Largest Contentful Paint
Time to Interactive is exactly equal to Largest Contentful Paint on 32.8% of mobile results, and is never lower than it. Lighthouse resolves TTI to the later of its inputs, so on a page with no significant work after the main paint the two collapse together. TTI is published for completeness but carries little information independent of LCP, and it is not used for any headline.
Applies to: metric-distribution, mobile-v-desktop, overview
C9
Severity: Medium
Speed Index partly restates First Contentful Paint
Speed Index is exactly equal to First Contentful Paint on 26.0% of mobile results. Lighthouse derives Speed Index from how a page's appearance fills in over time, so on a page that reaches its final appearance in a single paint the two collapse together. Published for completeness; not used for any headline.
Applies to: metric-distribution, mobile-v-desktop, overview
C10
Severity: Medium
Total Blocking Time and Layout Shift are concentrated at zero
Total Blocking Time is exactly zero on 35.2% of mobile results and Cumulative Layout Shift on 45.6%. A median of a distribution with that much mass at zero reports the zero and hides the tail. Both are reported as a share-at-zero alongside upper percentiles rather than as a median alone.
Applies to: metric-distribution, mobile-v-desktop, overview
C11
Severity: Low
The SEO category barely varies between devices
Mobile and desktop SEO scores are identical on 95.1% of domains audited on both. The category is built largely from device-independent checks, so it is reported as a single figure rather than framed as a mobile-versus-desktop comparison.
Applies to: mobile-v-desktop
C12
Severity: High
Builder detection only covers WordPress
A site builder is only ever identified on WordPress sites, which are 23.4% of all domains in the dataset. Every other domain, including every domain where no CMS was detected at all, is invisible to the builder analysis. Builder figures describe a subset of the dataset and must never be read as market share across UK trades websites generally.
Applies to: builder-performance, wordpress-builders
C13
Severity: High
The residual builder cohort is not a chosen tool
Within WordPress, 4,213 domains (41.1%) carry no third-party page builder. They arrive in two ways: 3,347 where the detector reported nothing, and 866 where it reported WordPress's own block editor, and the split tracks the strength of the detector's fingerprint rather than anything about the site: of the block-editor rows, 866 came from a moderate detection and 0 from a strong one, against 184 and 3,163 for the rows where nothing was reported (builder-performance.json). The two are therefore one residual cohort, sites where nothing else was detected, rather than a group that selected a product, and the block-editor subset is never published as a cohort of its own. The residual is labelled "WordPress, no third-party builder detected", reported with its size and medians, shown outside the rank sequence, and never charted as a score.
Applies to: builder-performance, wordpress-builders
C14
Severity: Low
A small number of audits returned only some categories
170 mobile and 140 desktop audits returned some category scores but not all, most often the static categories with no performance trace. They are counted in the denominator and contribute only the metrics they actually produced, so any given median may rest on slightly fewer rows than the cohort total. Each figure carries its own sample size.
Applies to every figure in this report.
C15
Severity: Medium
Trade labels are the source's, unmerged, and 17.7% are absent
7,740 domains carry no trade label in the source; they are reported as their own cohort rather than dropped or reassigned. Related labels that a reader might expect to be combined, carpenters and joiners, gardeners and landscape gardeners, are kept separate, because merging them is an editorial judgement about trades rather than a correction to the data.
Applies to: trade-performance, controlled-comparisons
C16
Severity: Medium
Cities are reported but not ranked
City-level medians are published in full, with sample sizes, but no city league table is produced. The spread between cities is too narrow relative to the sample to support an ordering, and a ranked table would present noise as a result.
Applies to: city-performance
C17
Severity: High
Nothing was assigned: this is an observational study
Every business in this dataset chose its own platform, its own trade and its own town. The audit measured what already existed, there is no control group, no randomisation and no intervention. A gap between two cohorts is therefore a difference between the sites that sit in them, not a measure of what a platform did to a site. Businesses that pick one platform may differ from those that pick another in ways this dataset did not observe: what they spent, how old the site is, who built it. Every comparison here is reported as a difference between groups, and no figure in this study can say what would happen to a site that moved from one platform to another.
Applies to every figure in this report.
C18
Severity: High
Trade is confounded with wave, city set and platform mix
Across the 26 trades large enough to rank, the share of a trade's sites collected in the first wave runs from 14.0% to 98.6%, 2 trades are drawn at least 90% from a single wave, and the waves differ in city coverage, audit-failure rate and seed-list quality (C2). The share of sites on WordPress runs from 21.7% to 46.5% and the share with no detectable platform from 32.3% to 48.5%, and platforms differ in median mobile Performance (cms-performance.json). A difference between two trades is therefore a difference between two mixtures of towns, waves and platforms that this study has not separated. The spread of trade medians (63 to 72) is also small beside the spread within a trade: the pooled interquartile range of the same score is 58 to 81. Trade exhibits are ordered by sample size rather than by score, the table is not a league table, and this study does not measure why any trade's sites score as they do.
Applies to: trade-performance, controlled-comparisons
C19
Severity: High
The dataset holds every website attempted, and almost no figure uses that as its denominator
This dataset is every one of the 43,738 websites the study requested an audit for, including the 12,708 that returned no usable automated audit on either device. That is deliberate: an earlier version of this dataset held only the websites that returned a result, which made the failure rate look far lower than it was and quietly changed the population every share described. Keeping the failed attempts costs nothing in measurement, they carry no scores to average, and it makes the population honest. The consequence is that 43,738 is the number of websites attempted and almost never the right denominator. Every figure in this report is published with the number of websites that returned that particular measurement, and those counts differ from each other: 30,397 websites returned a mobile Performance score, 30,399 a mobile LCP, 30,557 at least one mobile category score. Read the n beside a figure, not the size of the dataset.
Applies to every figure in this report.
When the audit returned nothing
Roughly three in ten attempts returned no usable automated audit. That is a failed measurement, not a broken website: the table separates the attempts where our own request to the audit service failed from the ones where the service itself reported that it could not produce a usable result for the page. Neither records why, and a website that could not be measured here may be perfectly serviceable to a visitor.
How often the audit returned nothing, and why
| Reason given | Reported by | Device | Websites | Of that device's failures |
|---|---|---|---|---|
| The audit could not load the page | The audit service | Mobile | 10,199 | 77.4% |
| The audit could not load the page | The audit service | Desktop | 10,164 | 77.4% |
| Could not connect to the audit API | Our request | Desktop | 1,984 | 15.1% |
| Could not connect to the audit API | Our request | Mobile | 1,982 | 15.0% |
| The audit recorded no content painted | The audit service | Mobile | 558 | 4.2% |
| The audit recorded no content painted | The audit service | Desktop | 525 | 4.0% |
| Server error from the audit API, body not kept | Our request | Desktop | 266 | 2.0% |
| Server error from the audit API, body not kept | Our request | Mobile | 257 | 1.9% |
| Request to the audit API timed out | Our request | Desktop | 108 | 0.8% |
| Request to the audit API timed out | Our request | Mobile | 104 | 0.8% |
| The response was not HTML | The audit service | Desktop | 79 | 0.6% |
| The response was not HTML | The audit service | Mobile | 76 | 0.6% |
Each row counts websites, per device, as a share of that device's failed attempts. “Our request” means the collector's own call to the audit API did not complete. “The audit service” means the request completed and the service reported that it could not return a usable result for that page, it does not say the website was unavailable to a visitor, and the reason was not recorded.
| Platform | Mobile failed | Desktop failed | Websites |
|---|---|---|---|
| No CMS detected | 51.3% | 51.1% | 24,379 |
| WordPress | 3.5% | 3.5% | 10,249 |
| Wix | 2.4% | 2.3% | 5,158 |
| Duda | 1.9% | 2.6% | 1,839 |
| GoDaddy Website Builder | 14.5% | 15.5% | 657 |
| Squarespace | 2.7% | 2.1% | 624 |
| Weebly | 1.6% | 4.3% | 257 |
| Webflow | 3.1% | 3.6% | 223 |
| Shopify | 7.5% | 4.8% | 146 |
| Joomla | 4.2% | 3.5% | 144 |
| Drupal | 1.6% | 1.6% | 62 |
- Sample
- 43,738 websites attempted. An audit failure is a failed measurement, not a broken website: nothing here records why a page could not be loaded, and the message the audit service returned was kept only in part.
- Source
- Websites for Tradespeople, "The State of UK Trades Websites 2026", dataset 2026-09.2. Lighthouse lab results via the PageSpeed Insights API.
Read this figure with
Sites with no detected CMS are partly sites the audit could not loadSeverity: high
The mobile audit fails on 51.3% of domains with no detected CMS, against 3.4% where a platform was identified. Platform detection was a separate fetch of the homepage, not part of the audit, but the two are not independent for all that: a site that did not answer the detector could not be fingerprinted, and a site that did not answer one request often did not answer the other. The undetected cohort is therefore selected, not random, and every per-platform row carries both its sample size and its own audit-failure rate so the selection is visible beside the medians rather than in a footnote. Detection also ran at a different time from the audit for the earlier wave: see the platform-detection row of the test conditions.
A small number of audits returned only some categoriesSeverity: low
170 mobile and 140 desktop audits returned some category scores but not all, most often the static categories with no performance trace. They are counted in the denominator and contribute only the metrics they actually produced, so any given median may rest on slightly fewer rows than the cohort total. Each figure carries its own sample size.
How we tested these findings
Collection ran in two waves. Every headline was recalculated inside each one separately; anything that did not hold across both was not published as a headline.
Every headline, recalculated inside each collection wave
| Figure | Pooled | Wave 1 | Wave 2 | Verdict |
|---|---|---|---|---|
| Domains where a CMS was identified | 44.3% | 45.1% | 43.3% | robust |
| Median Accessibility score, mobile | 89 | 89 | 89 | robust |
| Median SEO score, mobile | 92 | 92 | 92 | robust |
| Median Best Practices score, mobile | 81 | 81 | 81 | robust |
| Median Largest Contentful Paint, desktop | 1.4s | 1.4s | 1.4s | robust |
| Median Performance score, desktop | 90 | 90 | 90 | robust |
| LCP over 4000 ms in the lab, mobile | 72.5% | 71.9% | 73.2% | robust |
| Median Largest Contentful Paint, mobile | 6.7s | 6.7s | 6.7s | robust |
| Performance mobile: Good (90-100) | 15.7% | 15.7% | 15.6% | robust |
| Performance mobile: Needs improvement (50-89) | 73.6% | 73.9% | 73.2% | robust |
| Performance mobile: Poor (0-49) | 10.7% | 10.3% | 11.2% | robust |
| Median Performance score, mobile | 67 | 67 | 67 | robust |
| Domains recording a higher LCP on mobile than desktop | 99.5% | 99.5% | 99.5% | robust |
| Median mobile-minus-desktop LCP, domains with an LCP on both | 5.1s | 5.0s | 5.2s | robust |
| Domains scoring lower on mobile than desktop for Performance | 87.5% | 88.2% | 86.8% | robust |
| Median mobile-minus-desktop Performance score, domains audited on both | -18 | -18 | -18 | robust |
| Wix share of domains whose platform was identified | 26.6% | 27.7% | 25.4% | robust |
| WordPress share of domains whose platform was identified | 52.9% | 52.6% | 53.3% | robust |
| WordPress minus Wix, median mobile Performance score | -8 | -9 | -8 | robust |
| WordPress minus Wix, median mobile Performance score, strong fingerprint only | -7 | -7 | -7 | robust |
| Median mobile Performance score, WordPress | 61 | 61 | 61 | robust |
| Median mobile Performance score, WordPress, strong fingerprint only | 60 | 60 | 60 | robust |
| Median mobile Performance score, Wix | 69 | 70 | 69 | robust |
| Median mobile Performance score, WordPress, no third-party builder detected (within WordPress) | 65 | 65 | 64 | robust |
| Median mobile Performance score, Wix, strong fingerprint only | 67 | 67 | 67 | robust |
| Median mobile Performance score, Elementor (within WordPress) | 60 | 60 | 60 | robust |
| Median mobile Performance score, Duda | 77 | 78 | 75 | not used as a headline |
| Median mobile Performance score, Divi (within WordPress) | 59 | 58 | 59 | robust |
| Median mobile Performance score, WPBakery (within WordPress) | 57 | 57 | 57 | robust |
| Median mobile Performance score, Squarespace | 54 | 53 | 55 | robust |
| Median mobile Performance score, Beaver Builder (within WordPress) | 61 | 60 | 61 | robust |
| Trades where the WordPress median mobile Performance score is below Wix, of trades with enough websites on both | 100.0% | 100.0% | 100.0% | robust |
- Sample
- n = 43,738
- Source
- Websites for Tradespeople, "The State of UK Trades Websites 2026", dataset 2026-09.2. Lighthouse lab results via the PageSpeed Insights API.
Read this figure with
Two crawl waves with different audit-failure ratesSeverity: high
The audit ran in two near-disjoint waves: 23,525 domains between 30 July and 5 August 2026 across 183 towns and cities, and 20,213 between 30 August and 1 September 2026 across 18 large cities, with only a handful of domains appearing in both. Its mobile audit-failure rate is 30.8% against 29.6%, the share of its domains with no detectable platform is 56.7% against 54.9%, and among those undetected domains the failure rate is 53.0% against 49.9%. The waves therefore differ in date, city set, trade mix and list quality at once, so a gap between them cannot be told apart from the way the data was collected, and it must not be read as a difference between the websites. Platform share is the figure most exposed: it is quoted as a share of the sites that could be identified, with both wave figures beside the pooled one (cms-share.json). Every pooled figure is tested against the wave split before publication; see wave-sensitivity.json.
Download the data
The dataset behind every figure on this page, with the methodology that produced it beside it. This report, its analysis and the statistics derived from the data are CC BY 4.0; the row-level file's terms are set out below.
- One row per website: a pseudonymous Site ID, the platform we identified if we identified one, the audit outcome on each device, and every Lighthouse score and timing the audit returned, including the rows where it returned nothing, which are kept as missing measurements rather than dropped. No domain, no URL and no business name is in the file.
- Two columns are not in it: each website's town and its trade. Those come from the source directory's listings rather than from anything we measured, and we have not established that we may redistribute them, so they are withheld rather than published under terms we cannot grant. This changes no figure here, every statistic, the trades and cities chapters included, is computed from the complete internal dataset, and the per-trade and per-city aggregates are published in full beside this file.
- Cite it as: Websites for Tradespeople (2026), "The State of UK Trades Websites 2026", https://www.websitesfortradespeople.co.uk/research/state-of-uk-trades-websites-2026. This report, its analysis, its charts and the statistics derived from the data are published under CC BY 4.0: republish, reuse and build on them freely, with credit. The row-level file holds only measurements we made ourselves. Each website's town and trade originate in the source directory's listings rather than in anything we measured, and we have not established that we may redistribute them, so those two columns are withheld from the published file and no licence is asserted over the file itself. Every figure in this report is computed from the complete internal dataset, so none of them is affected. If you quote a figure, quote the number of websites beside it, every figure in this report carries one, and they differ from figure to figure.
- The methodology sits in the provenance panel at the top of this page and sets out how the sample was gathered, how each figure was calculated, which test conditions were retained and which were not, and why these numbers are not directly comparable with studies built on actual visits. The checksum below identifies the exact version of the row-level file that every figure here was computed from.
The anonymised row-level dataset: 43,737 rows and 30 columns, one row per website. No domains, no business names.
- Report licence
- CC BY 4.0
- Rows
- 43,737
- Checksum
- b03742f5751a4523…
The full anonymised dataset (CSV)
Please cite as: Websites for Tradespeople (2026), "The State of UK Trades Websites 2026", https://www.websitesfortradespeople.co.uk/research/state-of-uk-trades-websites-2026
For journalists and researchers
Everything in this report is free to quote with attribution, and there is no embargo. What follows is what you need to quote it accurately.
Press charts
- Mobile against desktop LCP, pairedPNG, 3200×1800
- Mobile LCP distributionPNG, 3200×1800
- Lighthouse Performance bandsPNG, 3200×1800
- Websites returning no usable auditPNG, 3200×1800
- WordPress against Wix, with controlled contextPNG, 3200×1800
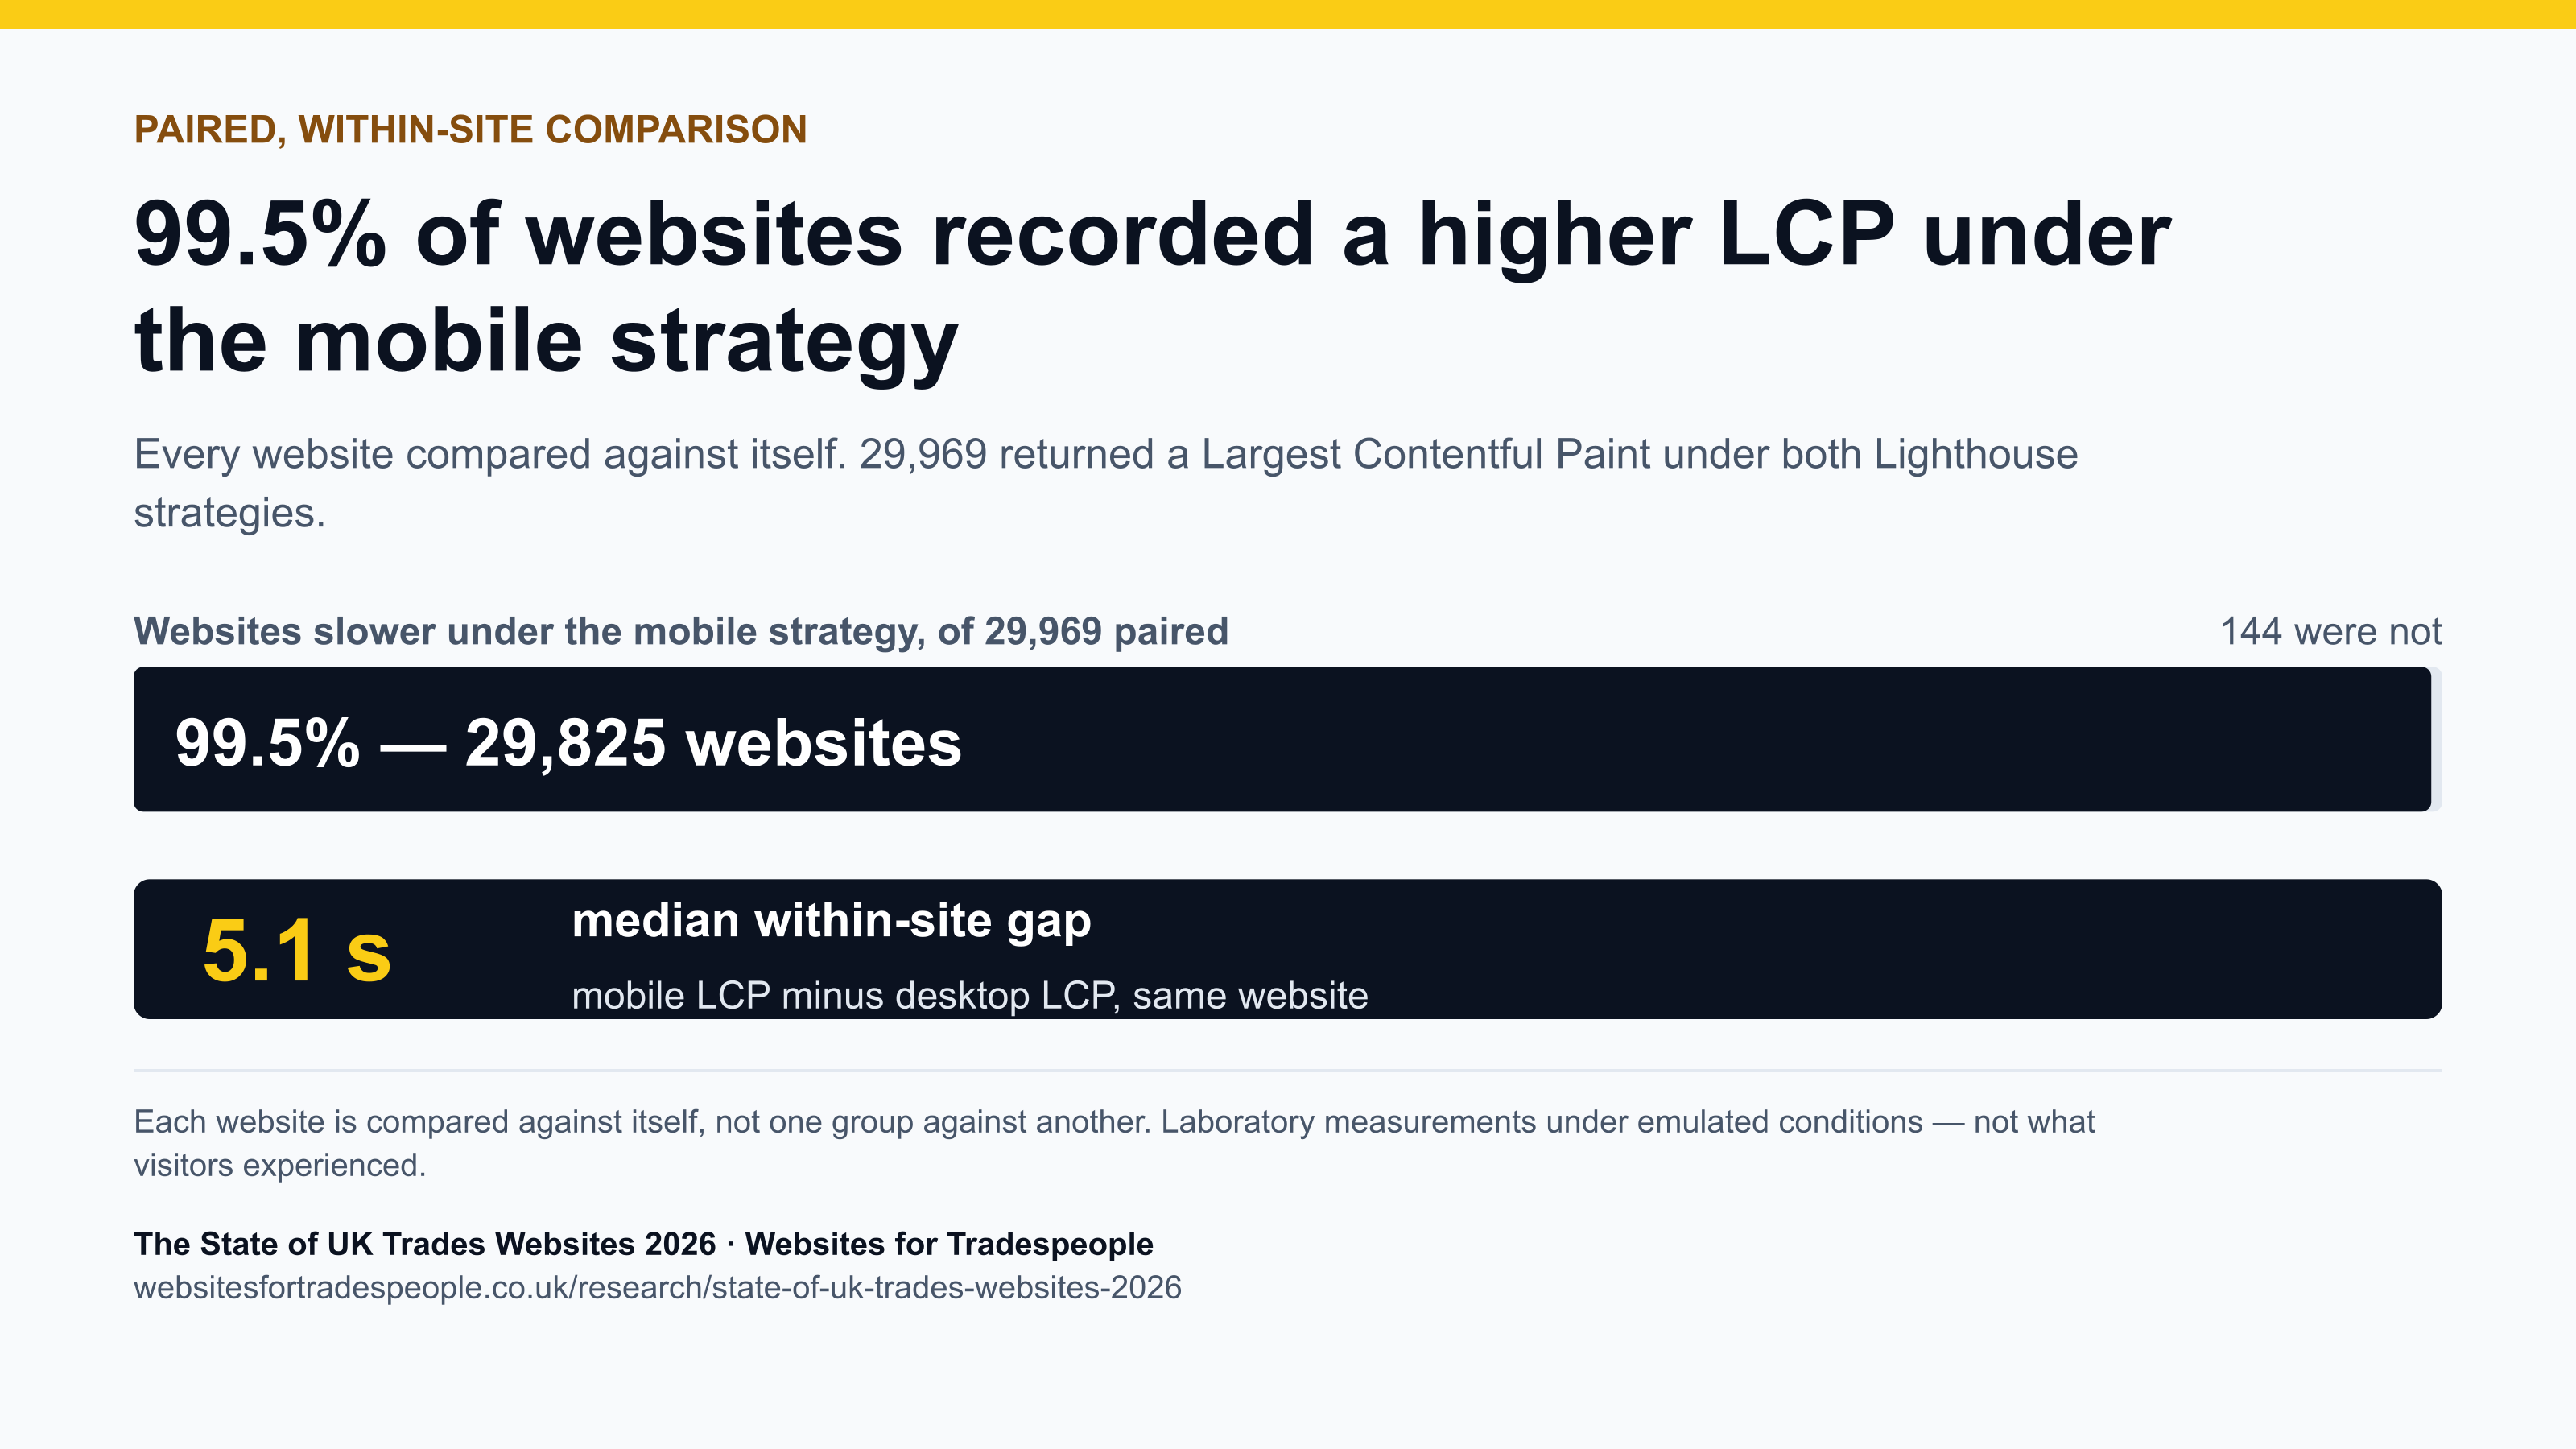
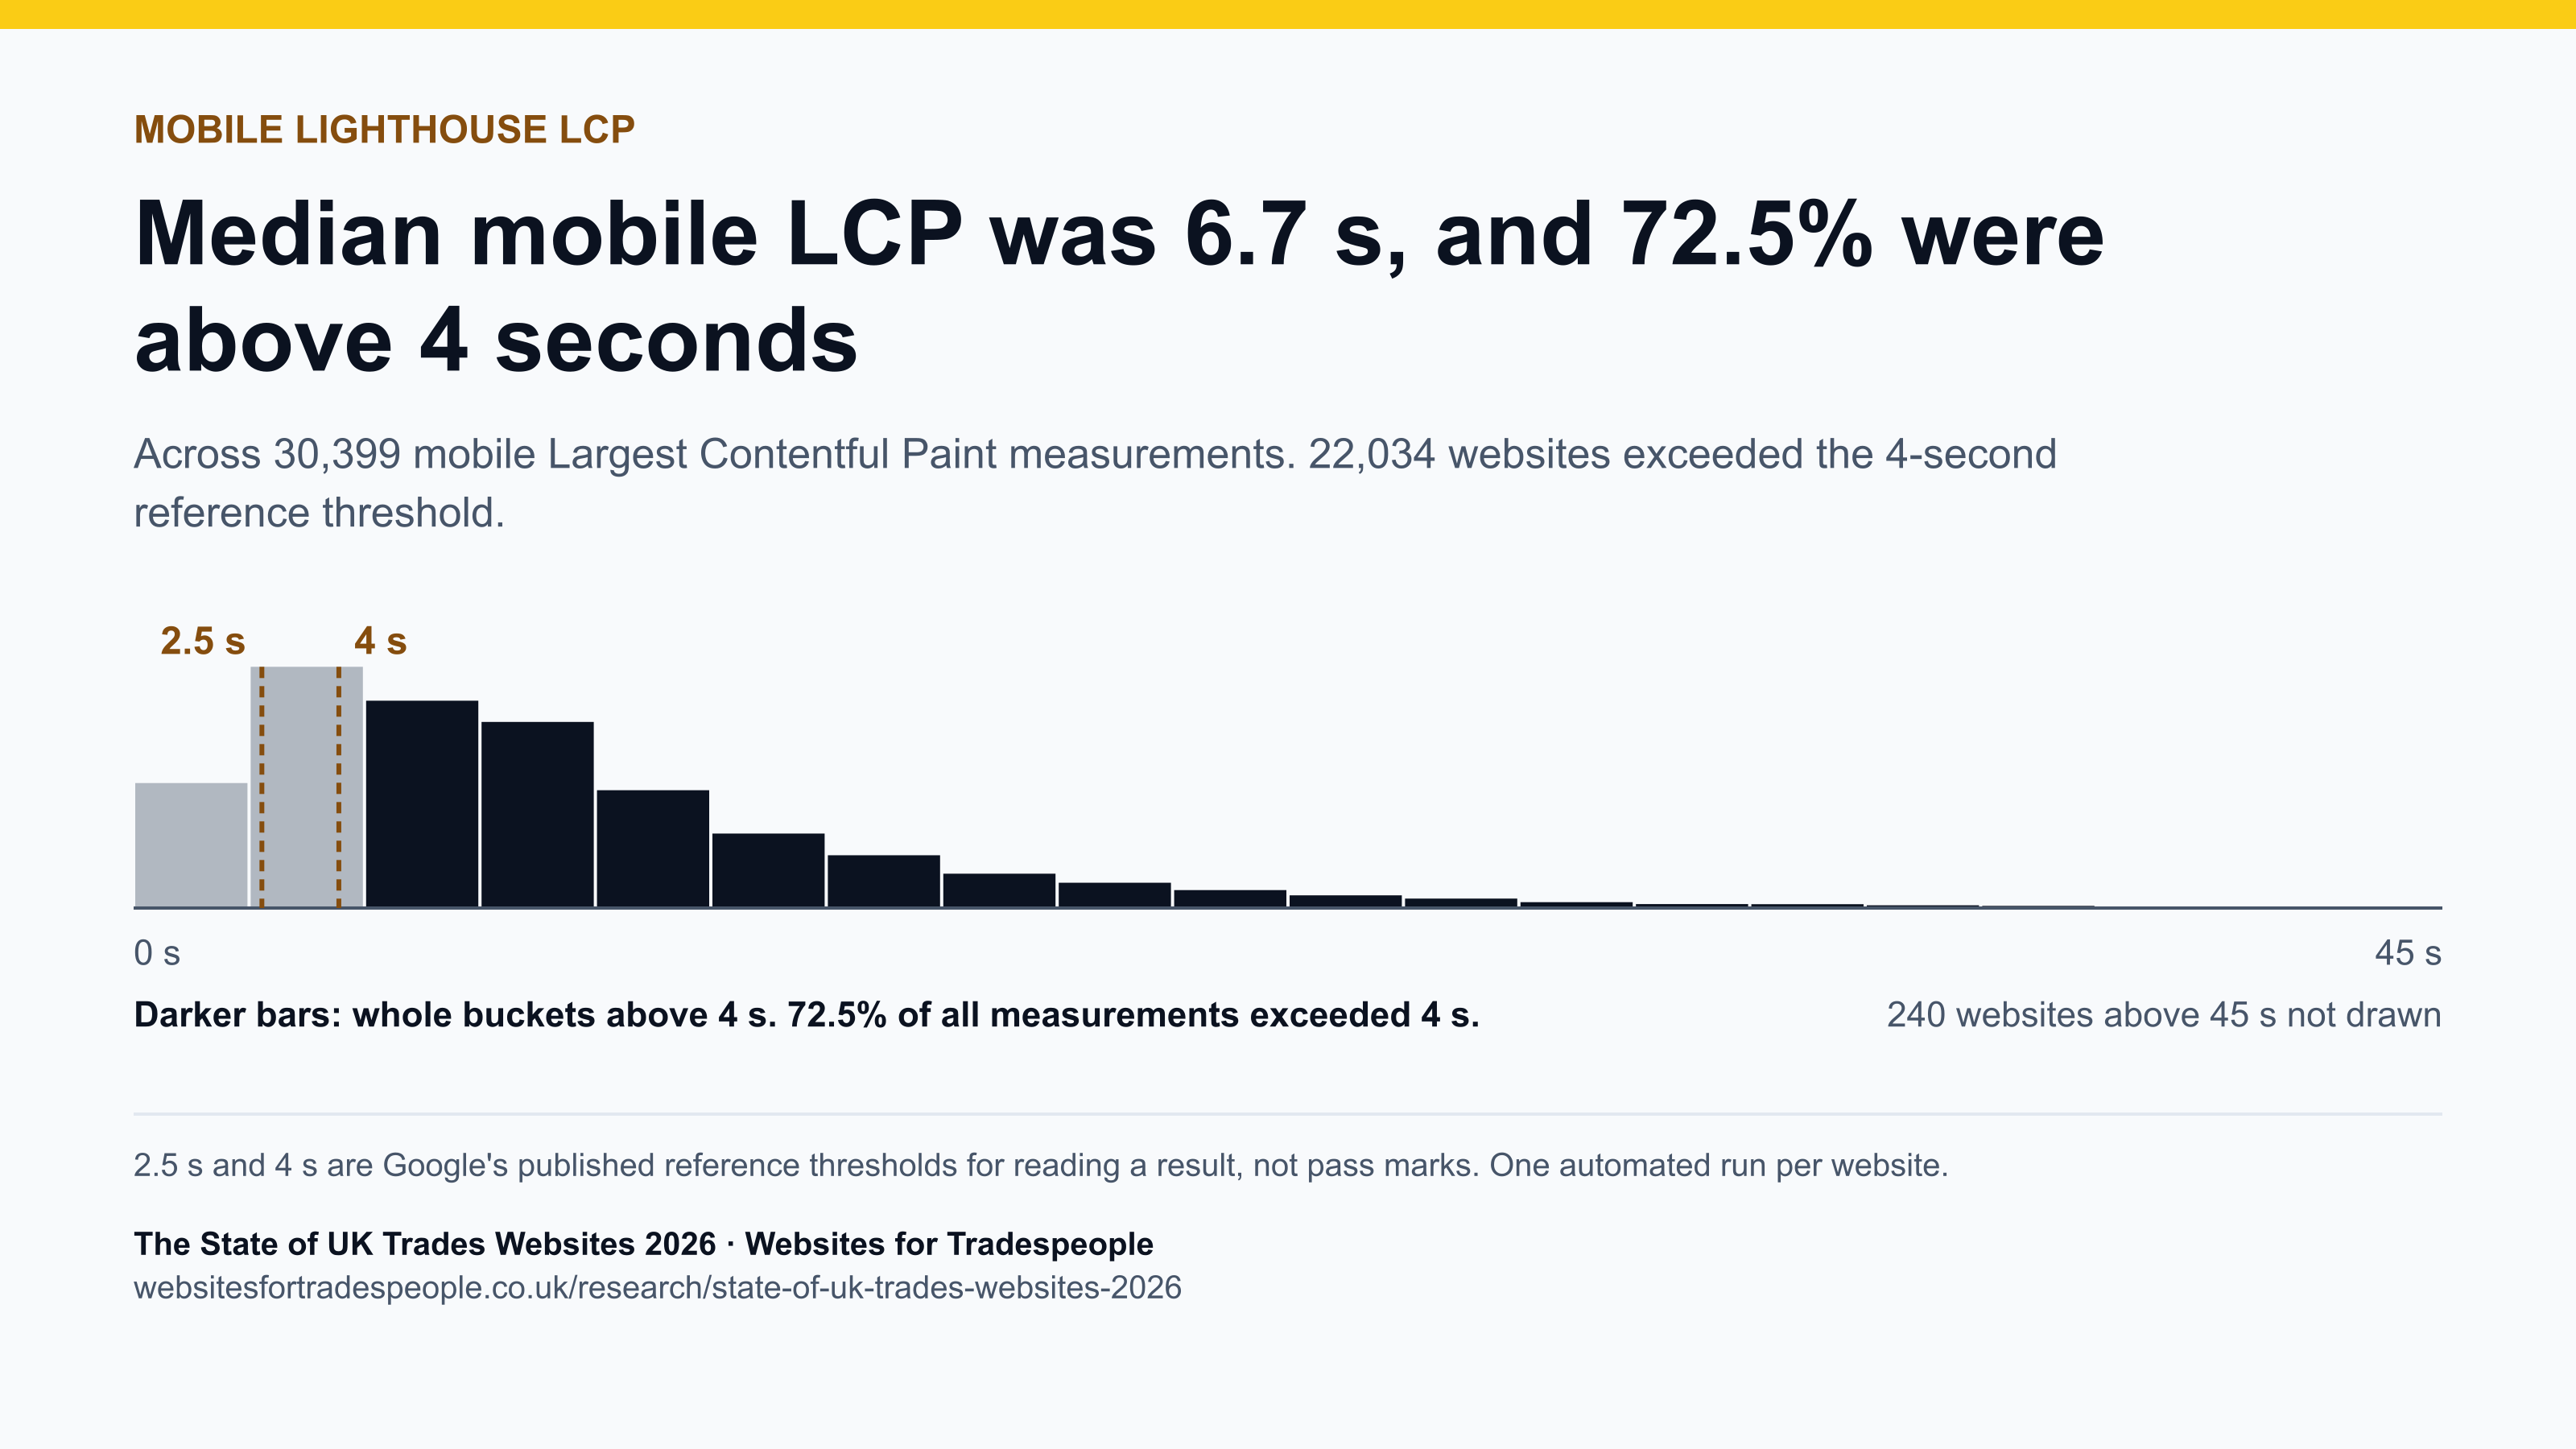
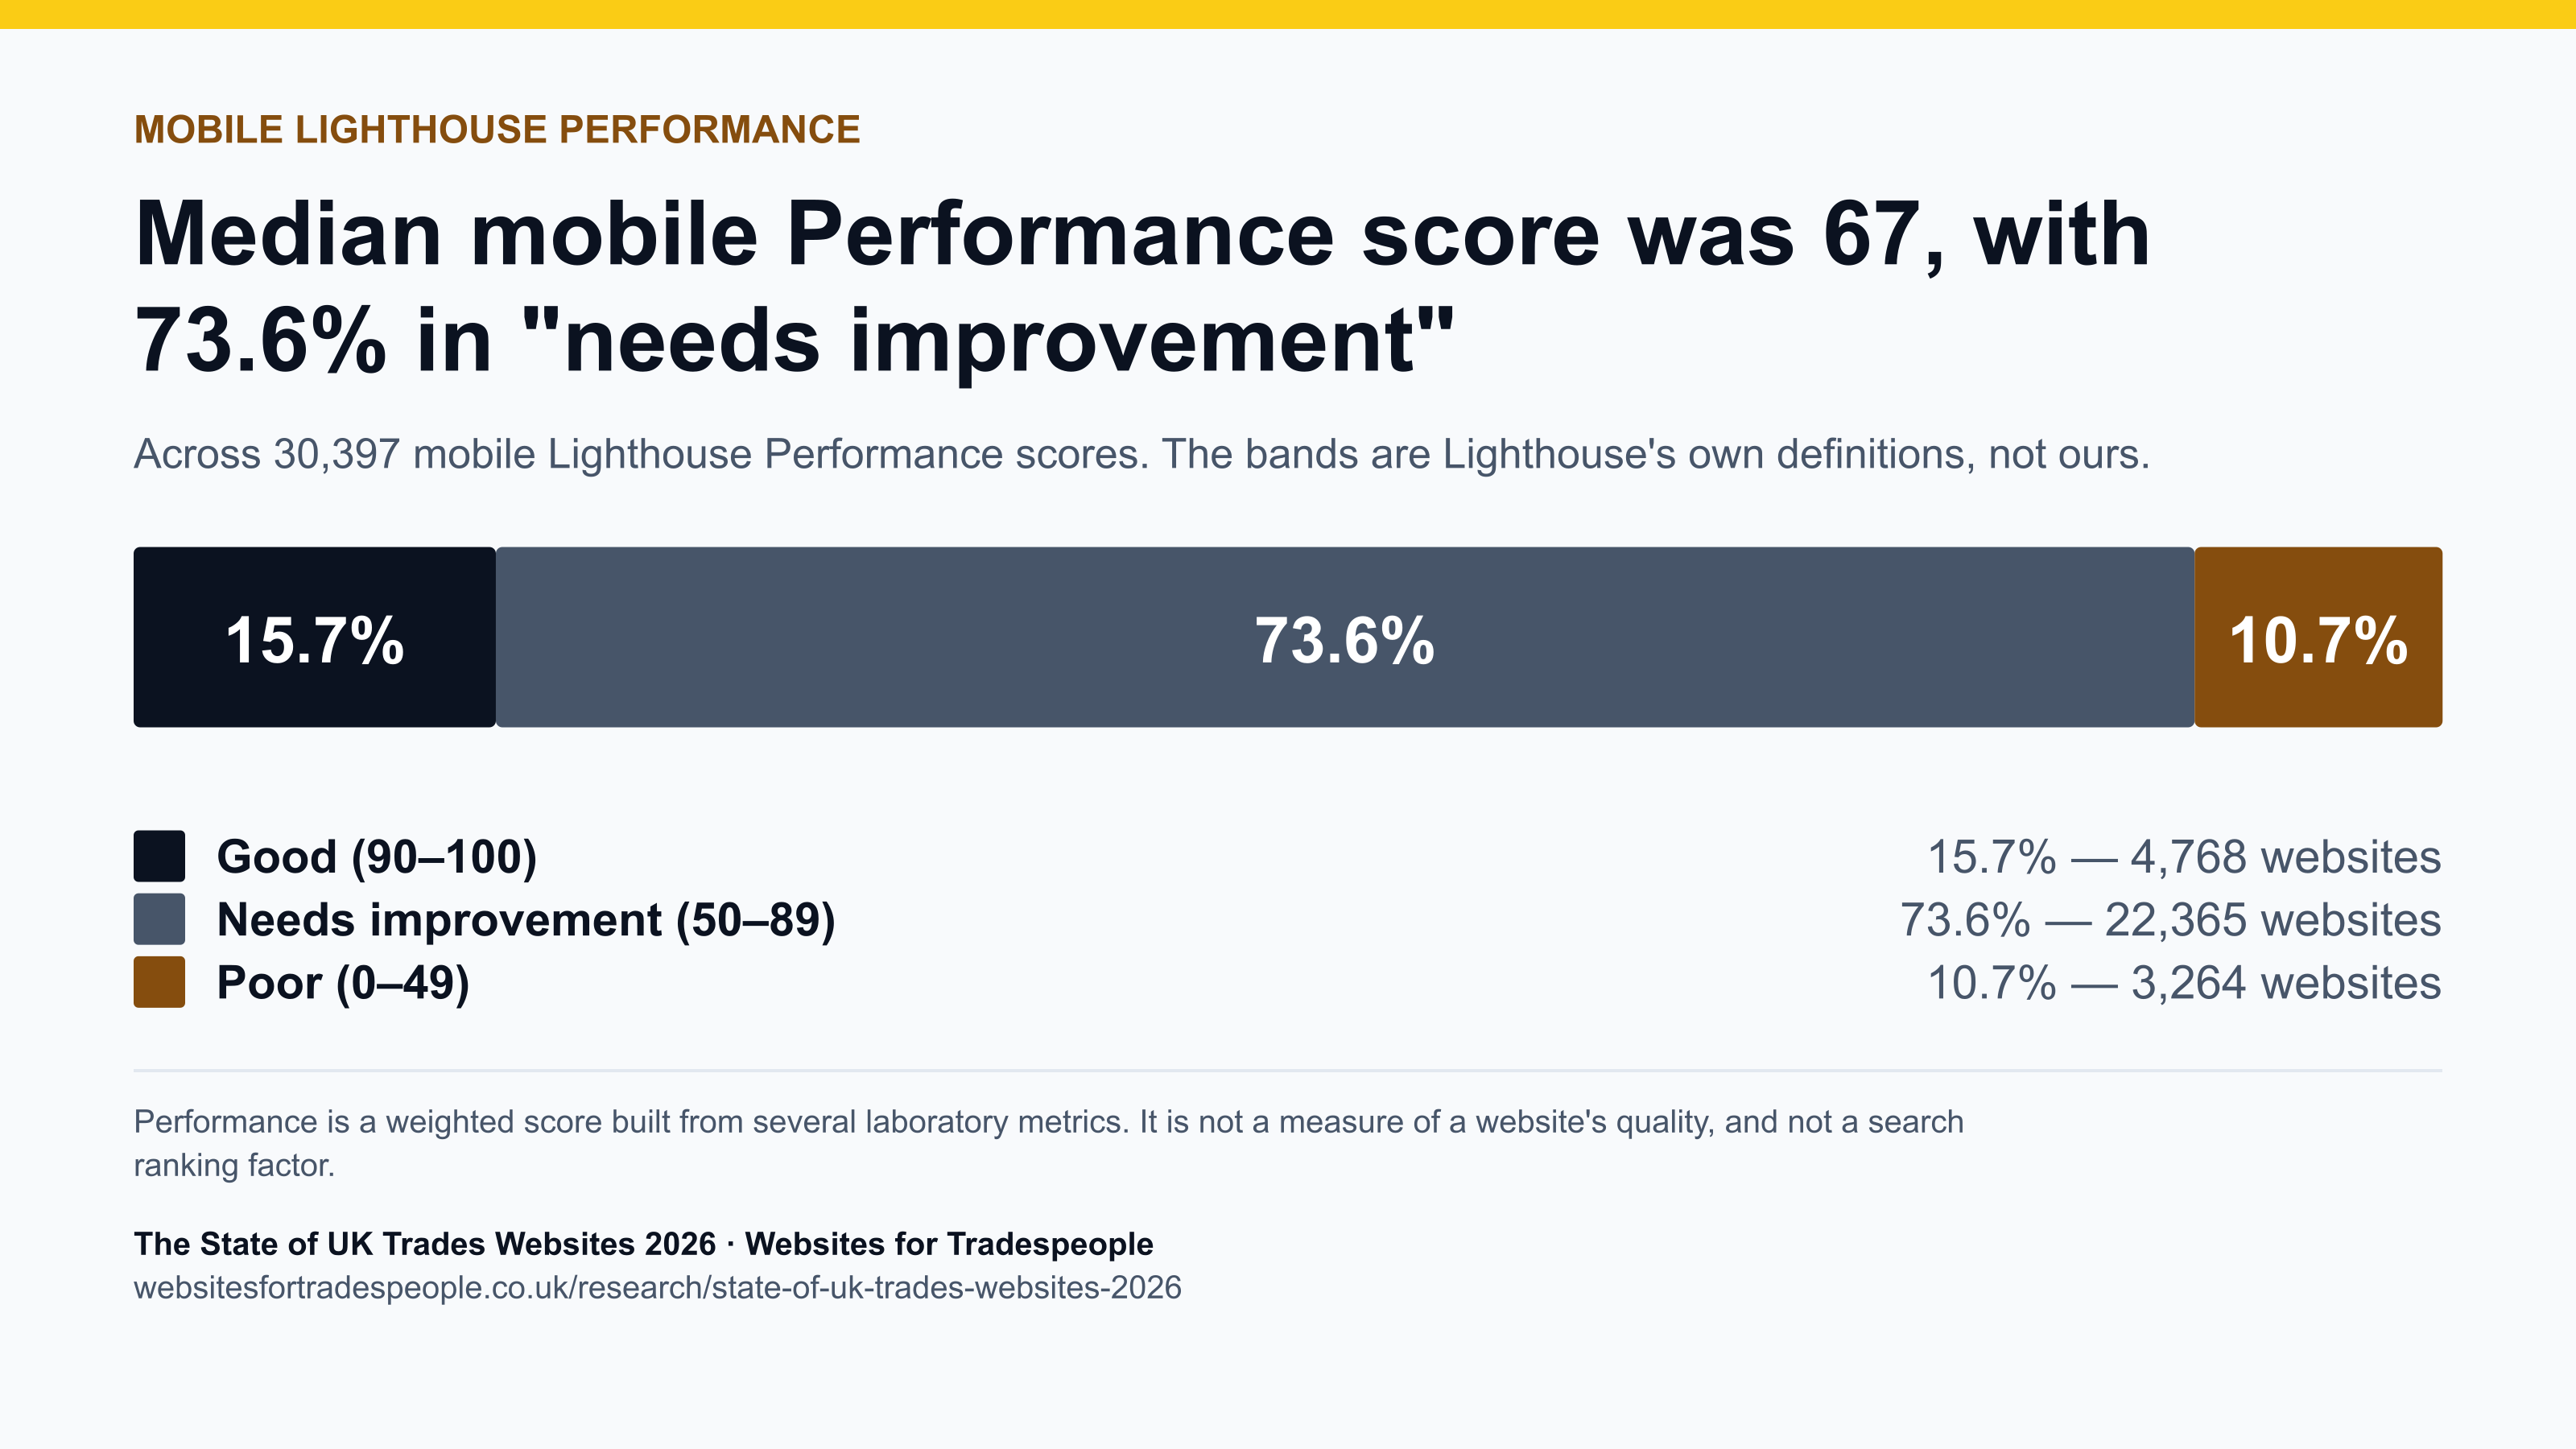
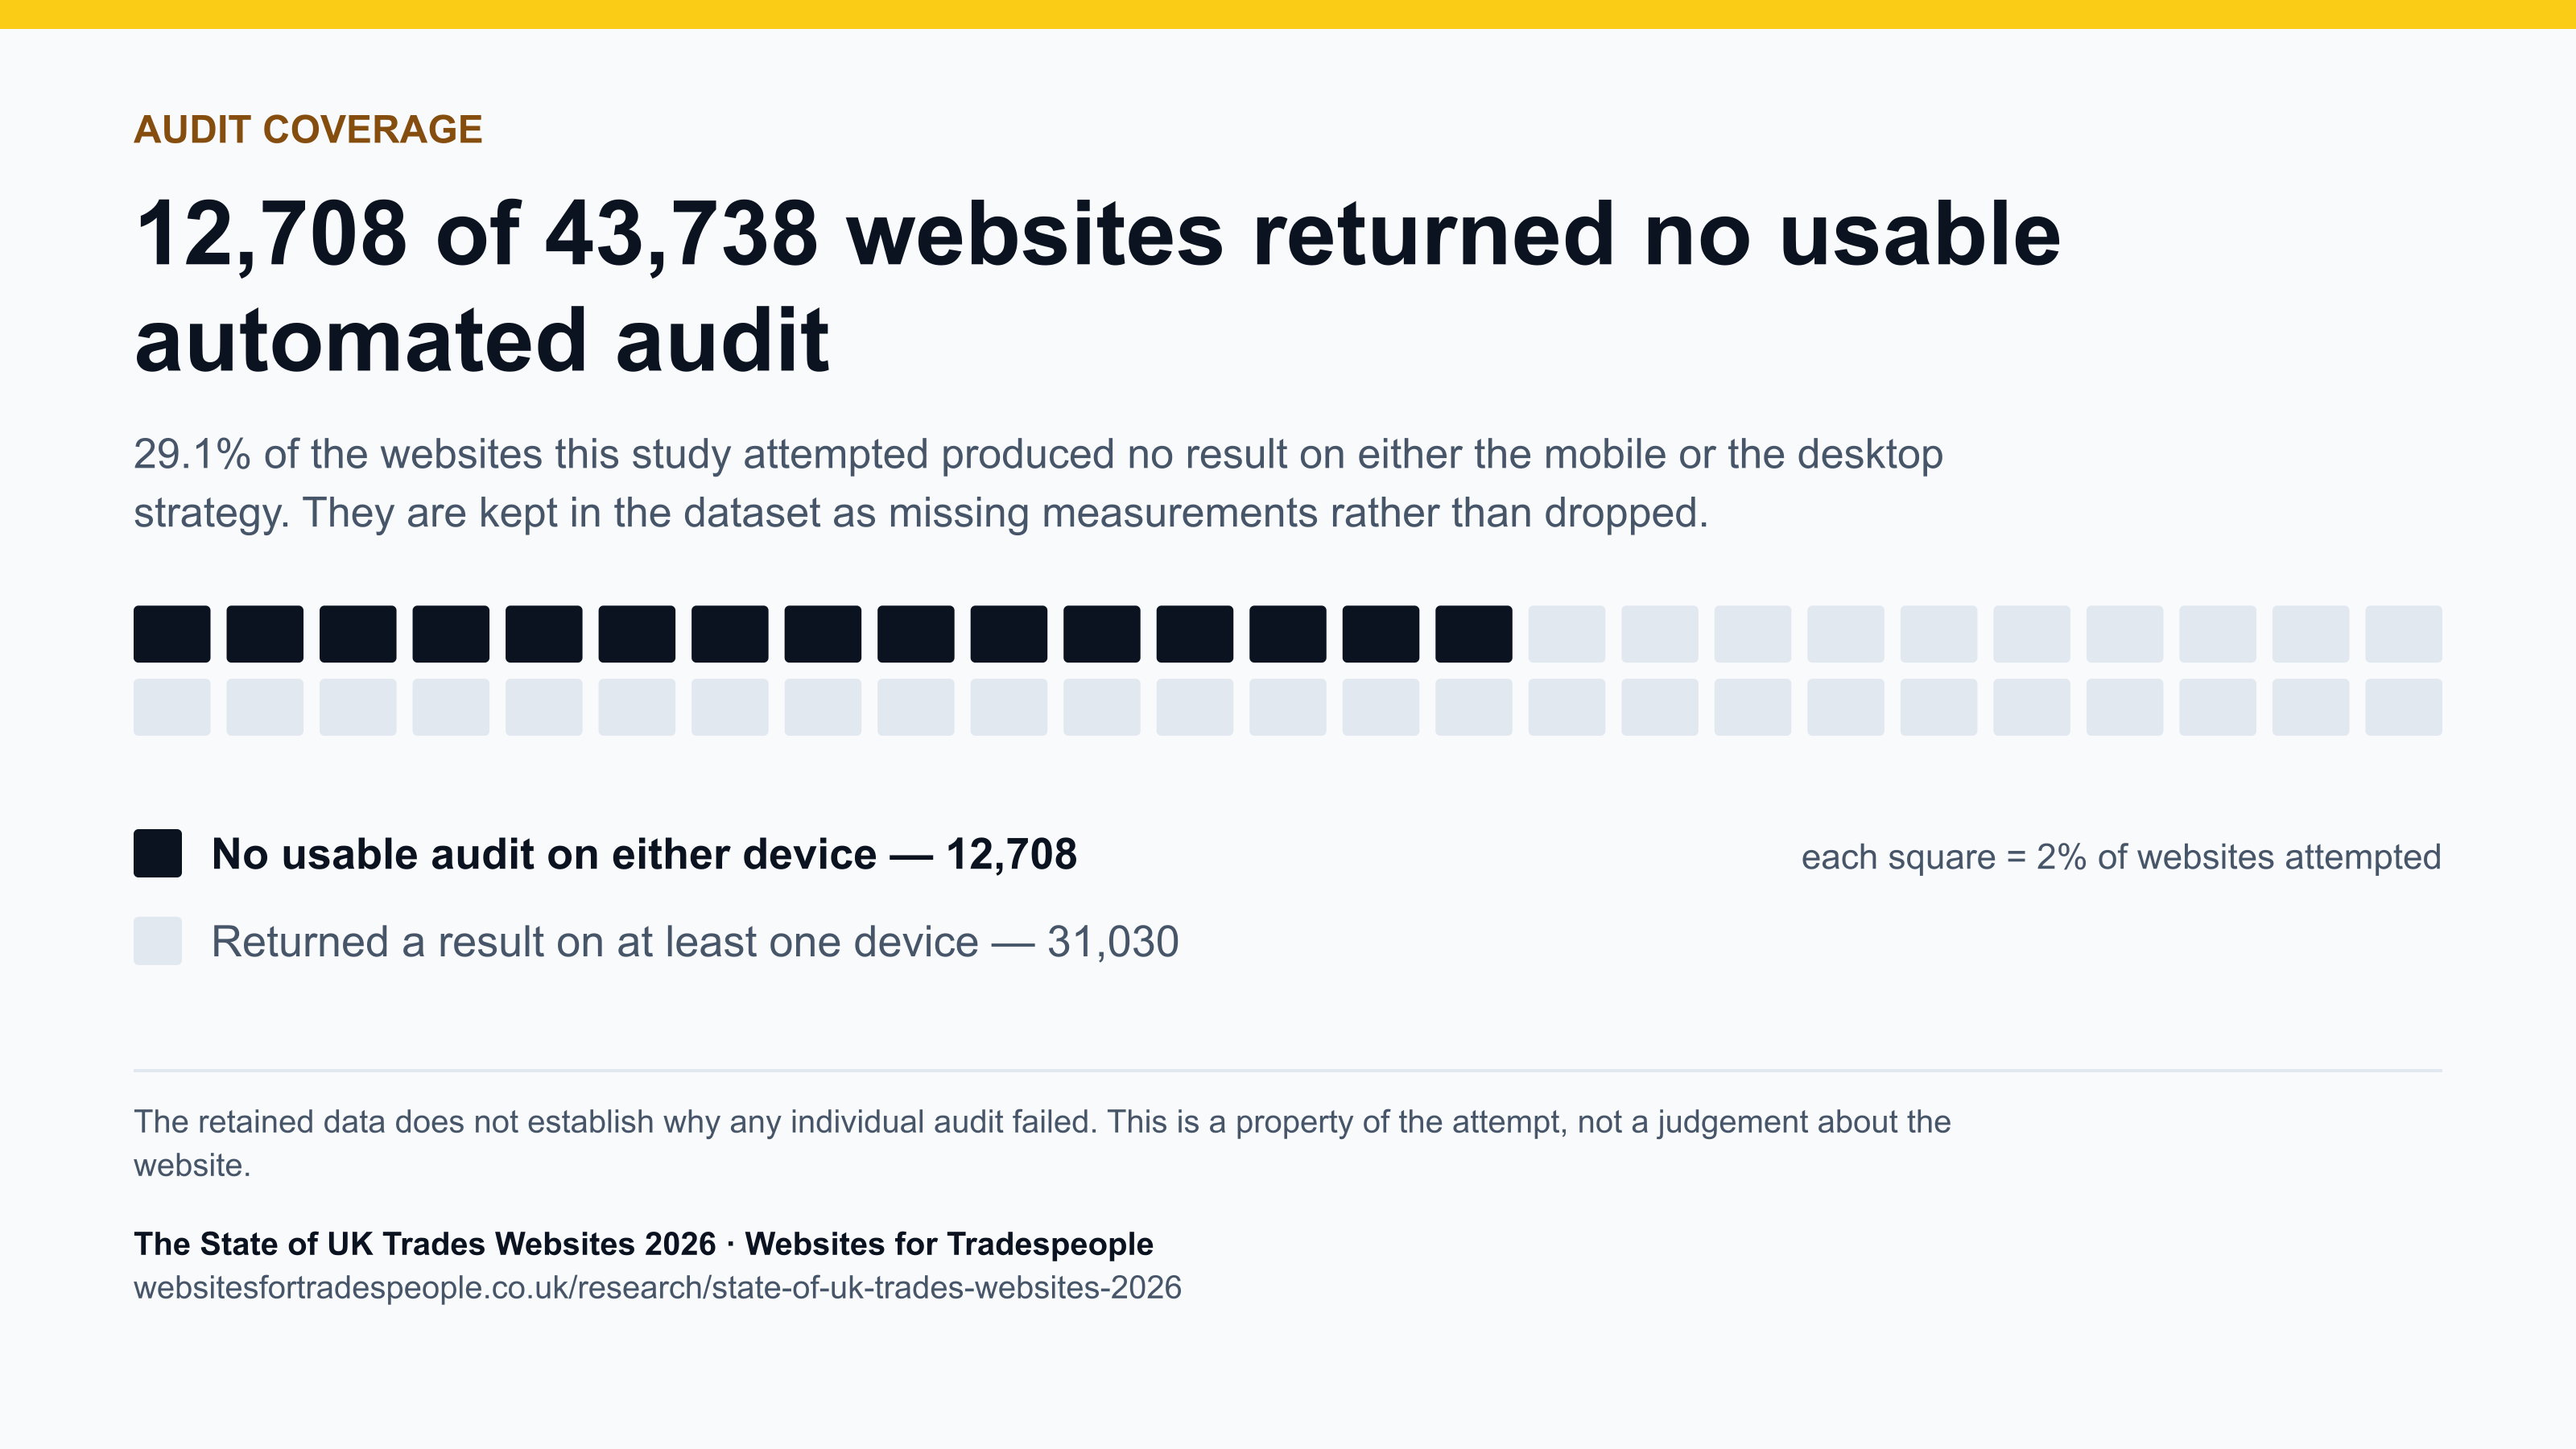
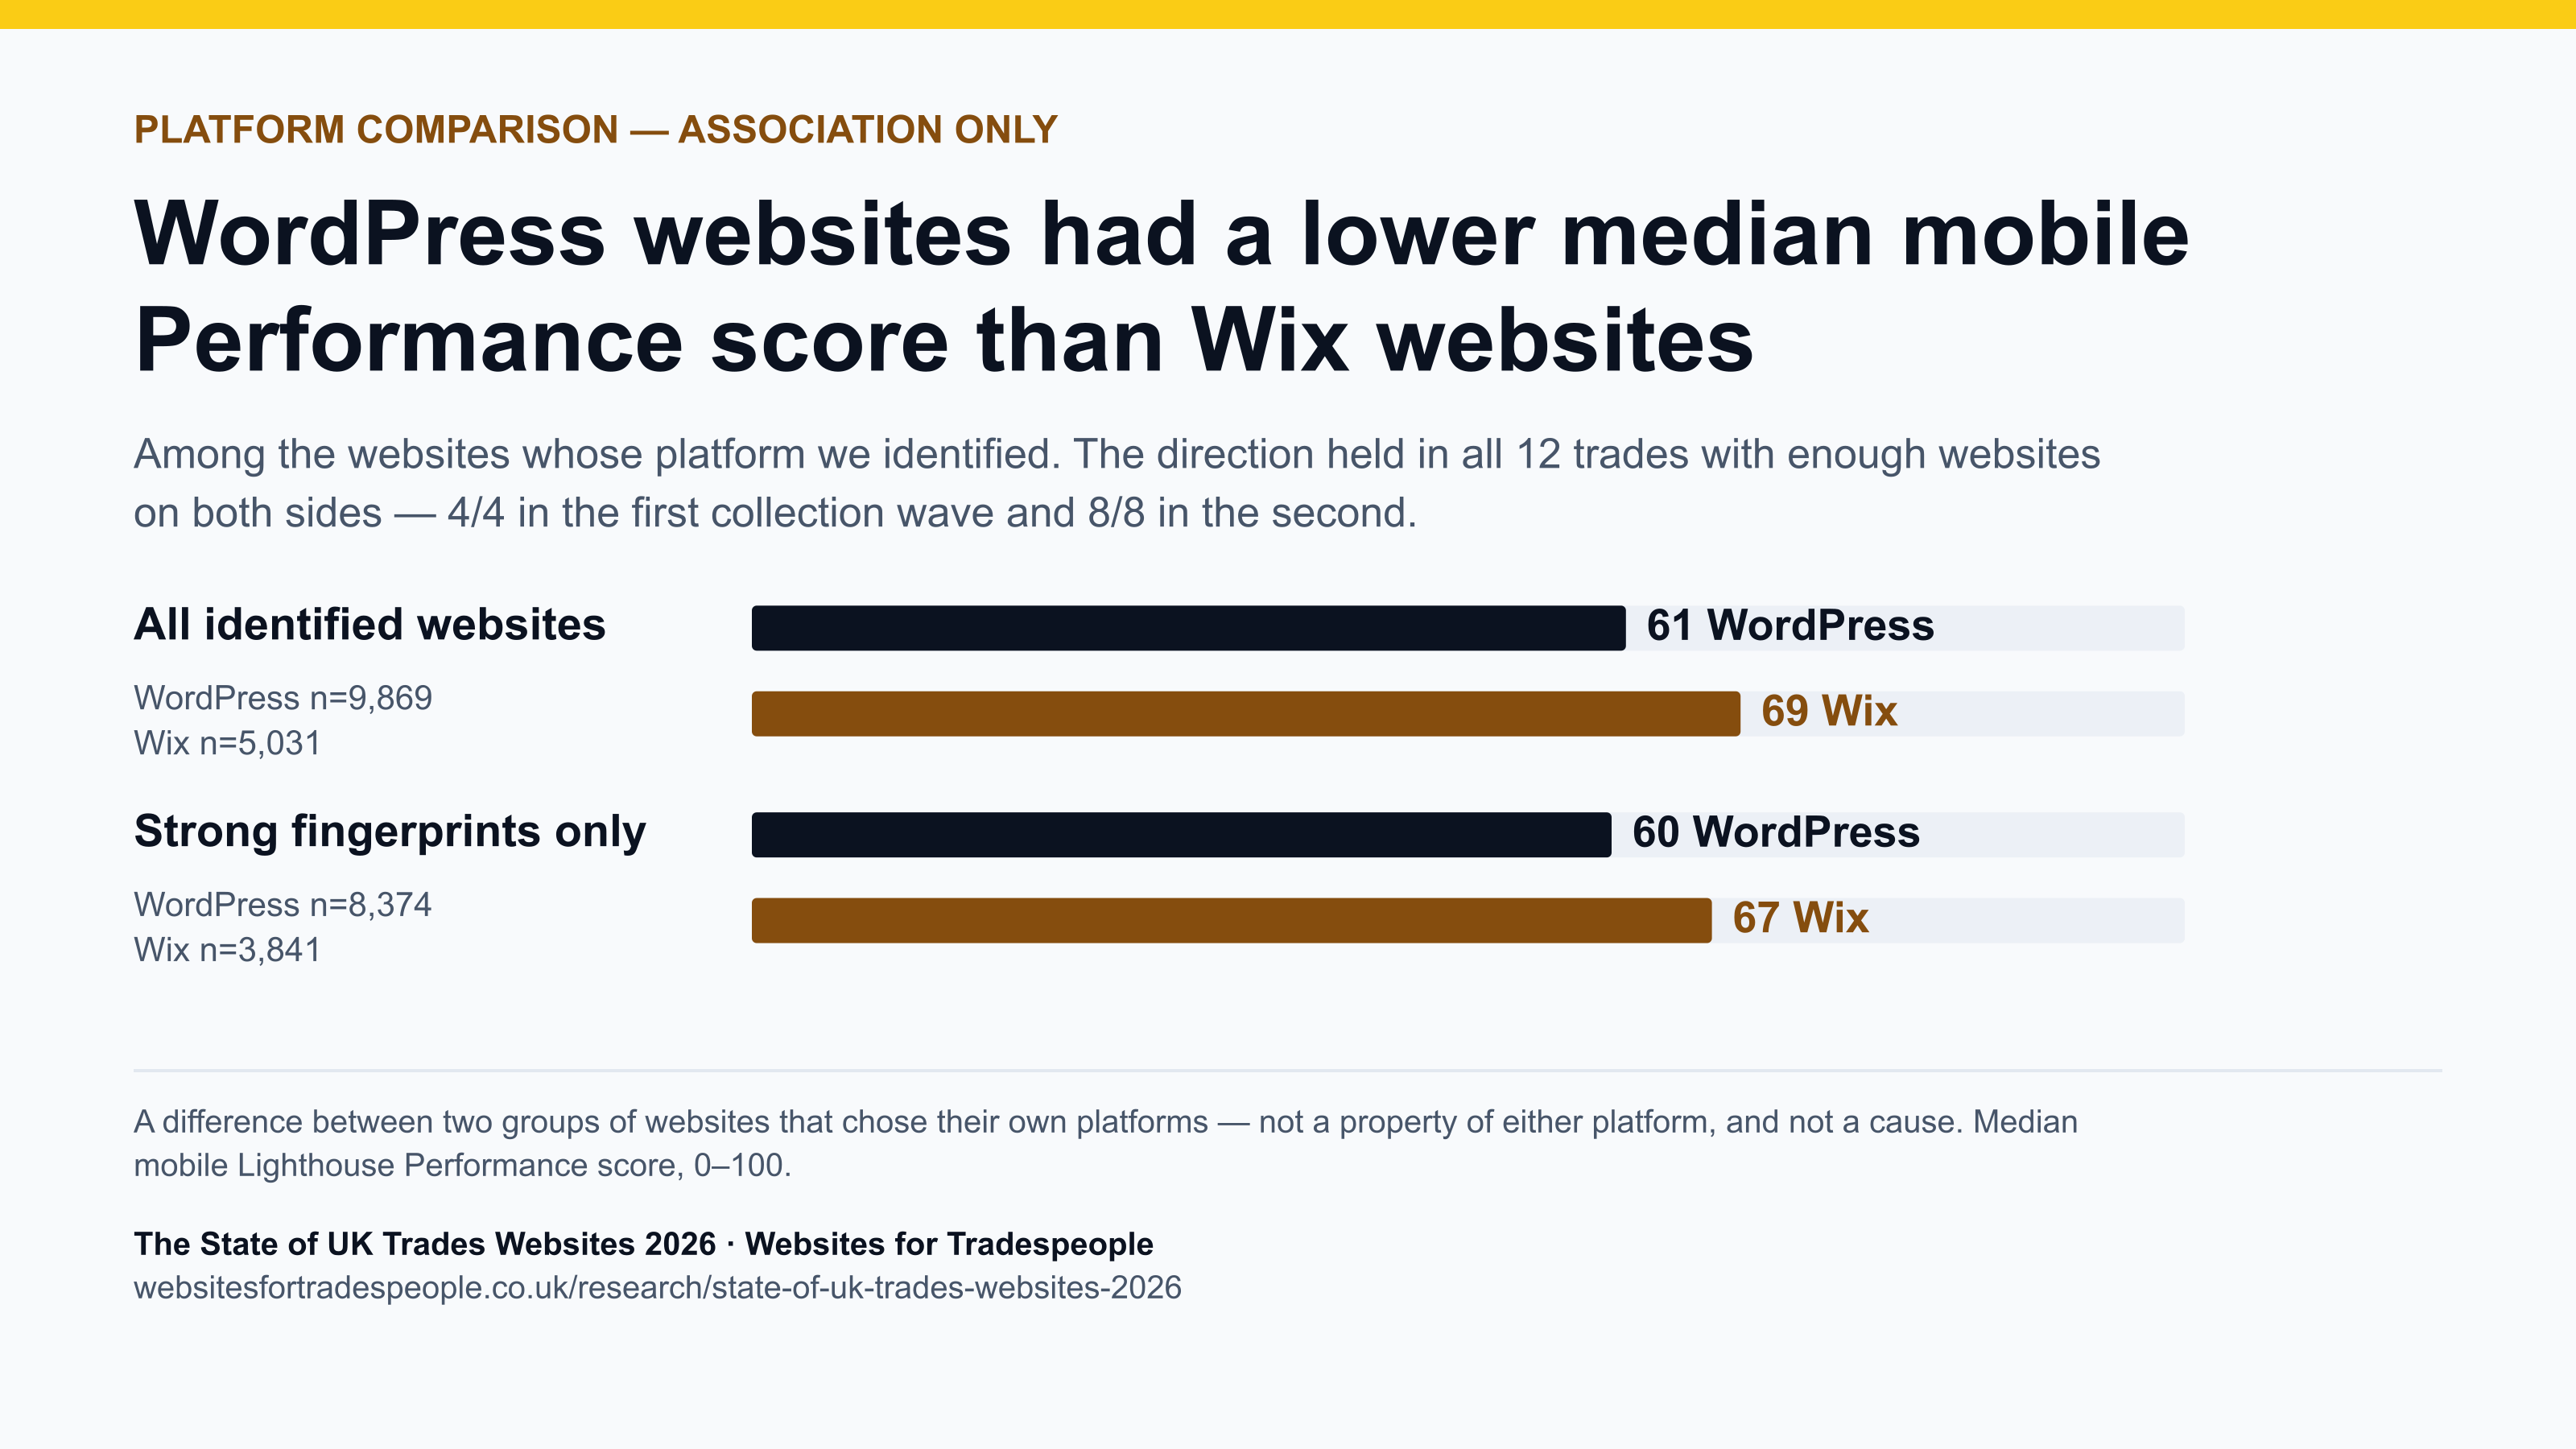
Free to reproduce with attribution to The State of UK Trades Websites 2026, Websites for Tradespeople. Each file carries its finding, its sample size, its source URL and the one caveat that finding cannot be read without, so it still says what it is when it travels without this page. A square version of each, and an SVG of every file, sits in the same folder.
- Quote the sample size with the figure, because the sample sizes are not the same. 43,738 websites were attempted; a Performance, timing or category measurement rests only on the websites that returned it, and those counts differ from figure to figure. Attempt- and coverage-level figures, how often an audit returned nothing, how often a platform could be identified, do rest on all 43,738. A figure quoted without its n is a figure someone else gets to characterise.
- Two distinctions the report keeps, and we would ask you to keep. These are laboratory measurements from an automated test, not a record of what visitors experienced. And they are observational: where two groups of websites differ, that is a difference between those groups, not evidence that a platform, trade or town produced it.
- Analytical findings promoted in the writing use results that held across both collection waves. Dataset counts, thresholds and provenance facts are structural facts and do not require a wave verdict. The tables carry more than the writing does, and anything in a table the prose does not quote is labelled descriptive.
- Charts may be screenshotted and reproduced with attribution; each one on this page is drawn as text and vector, so it stays sharp at any size, and each carries its title, its sample size and its source line, so a lifted image still says what it is. The five headline findings are also available below as press-ready files, generated from the same dataset as the report rather than redrawn.
- For a figure we have not published, a cut of the data we have not shown, or a question about method, write to us at hello@websitesfortradespeople.co.uk. If a figure here is wrong we will correct it in public, with the date and what changed.
Corrections and versions
This is dataset 2026-09.2. Its audits were collected between 2026-07-30 and 2026-09-01; the version identifies the analysis those audits went through, and neither date is the date this report was published. The report is generated from that version, and it will be corrected in public if it is wrong.
- Every figure on this page is read from the dataset at build time. A corrected figure means a new dataset version, a new build and a dated note here, never a number edited by hand.
- A material numerical change is recorded here with its date, what changed and why. A cosmetic fix to wording does not create a new dataset version unless it changes how a figure should be read.
- Earlier dataset versions keep their checksums, which are published with each release, so anything quoted from an earlier version can still be identified and checked against the version it came from. Where a superseded file is still held, it is available on request.
- If you believe a figure, a label or a method is wrong, write to us at hello@websitesfortradespeople.co.uk.
Questions people ask about these scores
Six questions readers arrive with, and what this study can and cannot say about each.
- What is a good PageSpeed score?
- Lighthouse draws the lines at 90 and 50: 90 to 100 is good, 50 to 89 needs improvement, below 50 poor. Those are Lighthouse's definitions. What this study adds is where real websites fell, a median of 67 on mobile across 30,397 websites, with 15.7% in the good band.
- Why is a mobile score lower than a desktop one?
- In this dataset it nearly always is: 87.5% of the 29,965 websites scored on both devices scored lower on mobile. Why is not something this study measured, the conditions the audit service applied were not recorded, and nothing about page weight, hosting or layout was collected.
- What is a good LCP?
- Google publishes reference thresholds of 2.5 seconds and 4 seconds for Largest Contentful Paint. In this sample the median mobile LCP was 6.7 seconds across 30,399 websites, and 72.5% were over 4 seconds. The thresholds are reference points for reading a result, not a pass mark.
- Why do these figures differ from studies based on actual visits?
- Because the two measure different things, over populations that need not overlap. This study is one automated laboratory test per listed URL; studies of that other kind aggregate visits to websites that meet their own inclusion criteria. Neither corrects the other. The methodology sets the difference out in full, and names the dataset involved.
- Does a Lighthouse SEO score show how well a website ranks?
- No. It is a set of automated checks for a subset of technical and on-page basics that Lighthouse can test. It does not measure search visibility, and a high score says nothing about how a search engine ranks the page.
- Is WordPress slower than Wix?
- Not a question this study can answer. What it can say is that among the websites whose platform we identified, the WordPress group had a lower median mobile Performance score than the Wix group, 61 across 9,869 websites against 69 across 5,031, and that the direction held inside every one of the 12 trades with enough websites on both sides. That is a difference between two groups of websites that chose their own platforms, not a property of either platform.
Know the price before you call
Tell us your trade, the towns you cover and what you've got online now. You'll get a fixed price and a timescale in writing.
We reply within one working day.